We use cookies to enhance the usability of our website. If you continue, we'll assume that you are happy to receive all cookies. More information. Don't show this again.
On the top, protein expression in current human tissue, based on all annotated cell types, is reported with the units not detected (n), low (l), medium (m) and high (h). Underneath, protein expression in each annotated cell type are reported using the same units. Protein expression data is based on knowledge-based annotation. For genes where more than one antibody has been used, a collective score is set. If knowledge-based annotation could not be performed for a gene, no data is displayed here. View antibody staining data further down this page.
No data
RNA expressioni
A summary of mRNA expression data available for current tissue based on several datasets. The mRNA expression levels in human tissues are based on RNA-seq data generated by the Human Protein Atlas HPA, Genotype-Tissue Expression GTEx portal and CAGE data generated by the FANTOM5 consortium. Consensus normalized expression levels for human tissues was created by combining the data from HPA and GTEx datasets. The mRNA expression levels in pig brain are based on RNA-seq data generated by the Human Protein Atlas, and for mouse brain HPA data and in situ hybridization generated by the Allen brain atlas dataset are reported.
Scroll down to view mRNA expression data in more detail.
The RNA-seq details section shows detailed information about the individual samples used for the transcript profiling and results of the RNA-seq analysis.
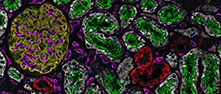
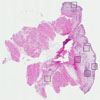
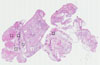
Information about each individual sample is listed below, including gender, age, a tissue section image and estimated fractions of cell types. nTPM (normalized transcripts per million) values give a quantification of the gene abundance which is comparable between different genes and samples.
Average nTPMi
Max subtype nTPM is the value for the subtype with the largest average nTPM across the subtype samples.
129.2
Male, age 74
Urinary bladder sample 264 nTPM: 120.4
Cell types%
Urothelial cells:
5
Smooth muscle cells:
60
Fibroblasts:
20
Endothelial cells:
10
Other cell types:
5
Male, age 80
Urinary bladder sample 265 nTPM: 129.6
Cell types%
Urothelial cells:
10
Smooth muscle cells:
45
Fibroblasts:
15
Endothelial cells:
10
Other cell types:
20
Female, age 0.1
Urinary bladder sample 1597 nTPM: 116.6
Female, age 0.1
Urinary bladder sample 1598 nTPM: 150.3
URINARY BLADDER - GTEx RNA-seqi
RNA-Seq data generated by the Genotype-Tissue Expression (GTEx) project from human tissues is reported as mean nTPM. More information can be found on the GTEx portal.
Distribution across the dataset is visualized with box plots, shown as median and 25th and 75th percentiles. Points are displayed as outliers if they are above or below 1.5 times the interquartile range. nTPM values of the individual samples are presented next to the box plot.
Max subtype nTPMi
Max subtype nTPM is the value for the subtype with the largest average nTPM across the subtype samples.
314.3
GTEx sample id
Sample description
nTPM
Bladder Average nTPM: 314.3
Samples: 77
Max nTPM: 578.3
Min nTPM: 179.0
Std nTPM: 86.0
Median nTPM: 312.1
GTEX-T5JC-1126-SM-GPIA1
20-29 years, male
578.3
GTEX-SE5C-1026-SM-4BRUG
40-49 years, female
514.7
GTEX-T2IS-2526-SM-GRR23
20-29 years, female
496.3
GTEX-TKQ2-0526-SM-GRR15
50-59 years, male
477.0
GTEX-P4QS-1926-SM-GQ1BY
60-69 years, male
469.7
GTEX-OHPK-1926-SM-H7OF2
50-59 years, female
441.0
GTEX-OOBJ-1926-SM-GRR1P
60-69 years, male
434.3
GTEX-RWS6-1426-SM-GPRWQ
60-69 years, female
433.3
GTEX-QDVJ-1526-SM-GPI84
50-59 years, male
429.1
GTEX-S4P3-0826-SM-H7OF3
50-59 years, female
428.8
GTEX-PLZ6-1026-SM-GQ1C8
30-39 years, male
417.4
GTEX-TMMY-1526-SM-4DXST
40-49 years, female
397.2
GTEX-S32W-1126-SM-4AD5V
50-59 years, female
391.2
GTEX-Q734-1226-SM-GRR21
40-49 years, female
389.3
GTEX-P44H-2226-SM-E9U4P
40-49 years, male
385.2
GTEX-NPJ8-1126-SM-GNTAI
40-49 years, male
383.6
GTEX-U3ZM-0826-SM-4DXU6
40-49 years, male
376.2
GTEX-QEG5-2326-SM-GRR2Z
20-29 years, male
374.5
GTEX-P78B-2126-SM-GQ1C3
40-49 years, female
371.1
GTEX-SUCS-1226-SM-GPI9A
70-79 years, male
371.0
GTEX-QV31-0926-SM-GQ1C6
30-39 years, male
370.5
GTEX-QXCU-2226-SM-GPI87
50-59 years, male
362.9
GTEX-QDT8-2826-SM-GOQYY
30-39 years, female
361.6
GTEX-QEL4-1826-SM-EZ6KU
50-59 years, male
360.5
GTEX-OXRK-1926-SM-GRR1N
50-59 years, female
357.5
GTEX-RN64-2426-SM-EZ6L2
50-59 years, male
341.2
GTEX-PLZ5-1326-SM-GQ1C2
50-59 years, male
341.0
GTEX-QMRM-1326-SM-HAUYS
50-59 years, male
335.8
GTEX-REY6-2026-SM-GPRYL
60-69 years, male
332.9
GTEX-PW2O-1026-SM-GPRWA
20-29 years, male
330.0
GTEX-OIZF-1926-SM-7PBZS
60-69 years, male
329.6
GTEX-QCQG-0826-SM-GPI8H
50-59 years, female
328.8
GTEX-P4PQ-1926-SM-GRR14
60-69 years, male
326.1
GTEX-Q2AH-1326-SM-GPRWF
40-49 years, male
324.1
GTEX-OIZI-1926-SM-H7OGY
40-49 years, male
324.0
GTEX-R55G-1326-SM-HAUYU
40-49 years, female
315.7
GTEX-OIZH-1926-SM-GPRXO
50-59 years, male
313.0
GTEX-QV44-1426-SM-GPI8D
50-59 years, male
312.4
GTEX-OHPM-1926-SM-H7OG1
50-59 years, male
312.1
GTEX-U4B1-1226-SM-4DXT7
40-49 years, male
305.9
GTEX-S4Q7-0926-SM-4AD5D
20-29 years, male
301.1
GTEX-QEG4-2126-SM-GQ1CE
30-39 years, male
301.0
GTEX-P4QT-1926-SM-HAUYQ
50-59 years, female
293.0
GTEX-RM2N-1026-SM-GOQY8
50-59 years, male
293.0
GTEX-RWSA-2126-SM-H7OG7
40-49 years, male
290.7
GTEX-R55C-1226-SM-GOQY7
40-49 years, male
289.9
GTEX-T6MO-0926-SM-GPRWN
40-49 years, female
273.2
GTEX-S4UY-0926-SM-4AD6O
40-49 years, female
269.6
GTEX-S95S-0626-SM-EZ6L8
60-69 years, male
267.4
GTEX-N7MT-1826-SM-GQ1C9
60-69 years, female
267.2
GTEX-RNOR-2126-SM-EXURR
50-59 years, female
266.9
GTEX-N7MS-2126-SM-GRR2X
60-69 years, male
266.7
GTEX-P4PP-1926-SM-HAUZM
30-39 years, female
266.6
GTEX-S3XE-1226-SM-4AD4L
50-59 years, male
265.3
GTEX-T6MN-2226-SM-EVYAM
50-59 years, male
262.0
GTEX-QLQW-0826-SM-H7OG2
30-39 years, male
256.5
GTEX-U3ZN-1226-SM-4DXUD
30-39 years, female
250.3
GTEX-SNMC-0826-SM-4DM66
20-29 years, male
241.5
GTEX-PWCY-1126-SM-H7OGX
20-29 years, female
238.9
GTEX-SNOS-0526-SM-4DM54
40-49 years, male
234.4
GTEX-U3ZH-0826-SM-H6Q7I
30-39 years, male
228.7
GTEX-QDVN-1426-SM-GPRWL
50-59 years, male
228.3
GTEX-R45C-2426-SM-HL11G
60-69 years, female
225.5
GTEX-OOBK-1926-SM-HAUZL
40-49 years, male
222.2
GTEX-PWN1-1926-SM-HAUZN
40-49 years, female
220.9
GTEX-S7SF-1126-SM-GQ1CH
20-29 years, female
217.6
GTEX-O5YT-1926-SM-H6Q82
20-29 years, male
212.2
GTEX-POMQ-0926-SM-H6Q6H
20-29 years, female
211.7
GTEX-RUSQ-1326-SM-GQ1EA
50-59 years, male
210.1
GTEX-T5JW-1026-SM-EZ6LR
20-29 years, female
208.8
GTEX-Q2AI-1026-SM-GRR3I
40-49 years, male
208.0
GTEX-PX3G-1926-SM-GQ1ED
20-29 years, female
206.4
GTEX-T8EM-1726-SM-GPRWO
40-49 years, male
202.4
GTEX-R53T-1426-SM-H7OG3
50-59 years, female
199.5
GTEX-QLQ7-1226-SM-GOQYE
60-69 years, male
194.4
GTEX-S33H-1926-SM-EYYVH
30-39 years, male
185.9
GTEX-OHPL-1926-SM-HAV18
60-69 years, female
179.0
Show allShow less
URINARY BLADDER - FANTOM5 CAGEi
RNA expression in human tissues obtained through Cap Analysis of Gene Expression (CAGE) generated by the FANTOM5 project are reported as Scaled Tags Per Million.
Max subtype Scaled Tags Per Millioni
Max subtype Scaled Tags Per Million is the value for the subtype with the largest average Scaled Tags Per Million across the subtype samples.
 The Human Protein Atlas project is funded