AGPAT4
Search result
SUMMARY
TISSUE
BRAIN
SINGLE CELL
SUBCELL
CANCER
BLOOD
CELL LINE
STRUCTURE
INTERACTION
|
TISSUE
PRIMARY DATA
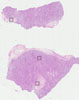
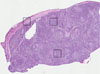
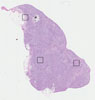
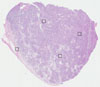
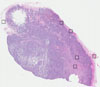
LYMPH NODE

ANTIBODIES
AND VALIDATION 
Dictionary
Lymph node
Tissue proteome
Lymphoid tissue
Tissue methods

|
|
|||||||||||||||||||||||||||||||||||||||||||||||||||||||||||||||||||||||||||||||||||||||||||||||||||||||||||||||||||||||||||||||
 The Human Protein Atlas project is funded