WDR83OS
Search result
SUMMARY
TISSUE
BRAIN
SINGLE CELL
SUBCELL
CANCER
BLOOD
CELL LINE
STRUCTURE
INTERACTION
|
TISSUE
PRIMARY DATA
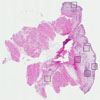
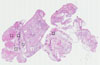
URINARY BLADDER

ANTIBODIES
AND VALIDATION 
Dictionary
Urinary bladder
Tissue proteome
Tissue methods

|
|
||||||||||||||||||||||||||||||||||||||||||||||||||||||||||||||||||||||||||||||||||||||||||||||||||
 The Human Protein Atlas project is funded