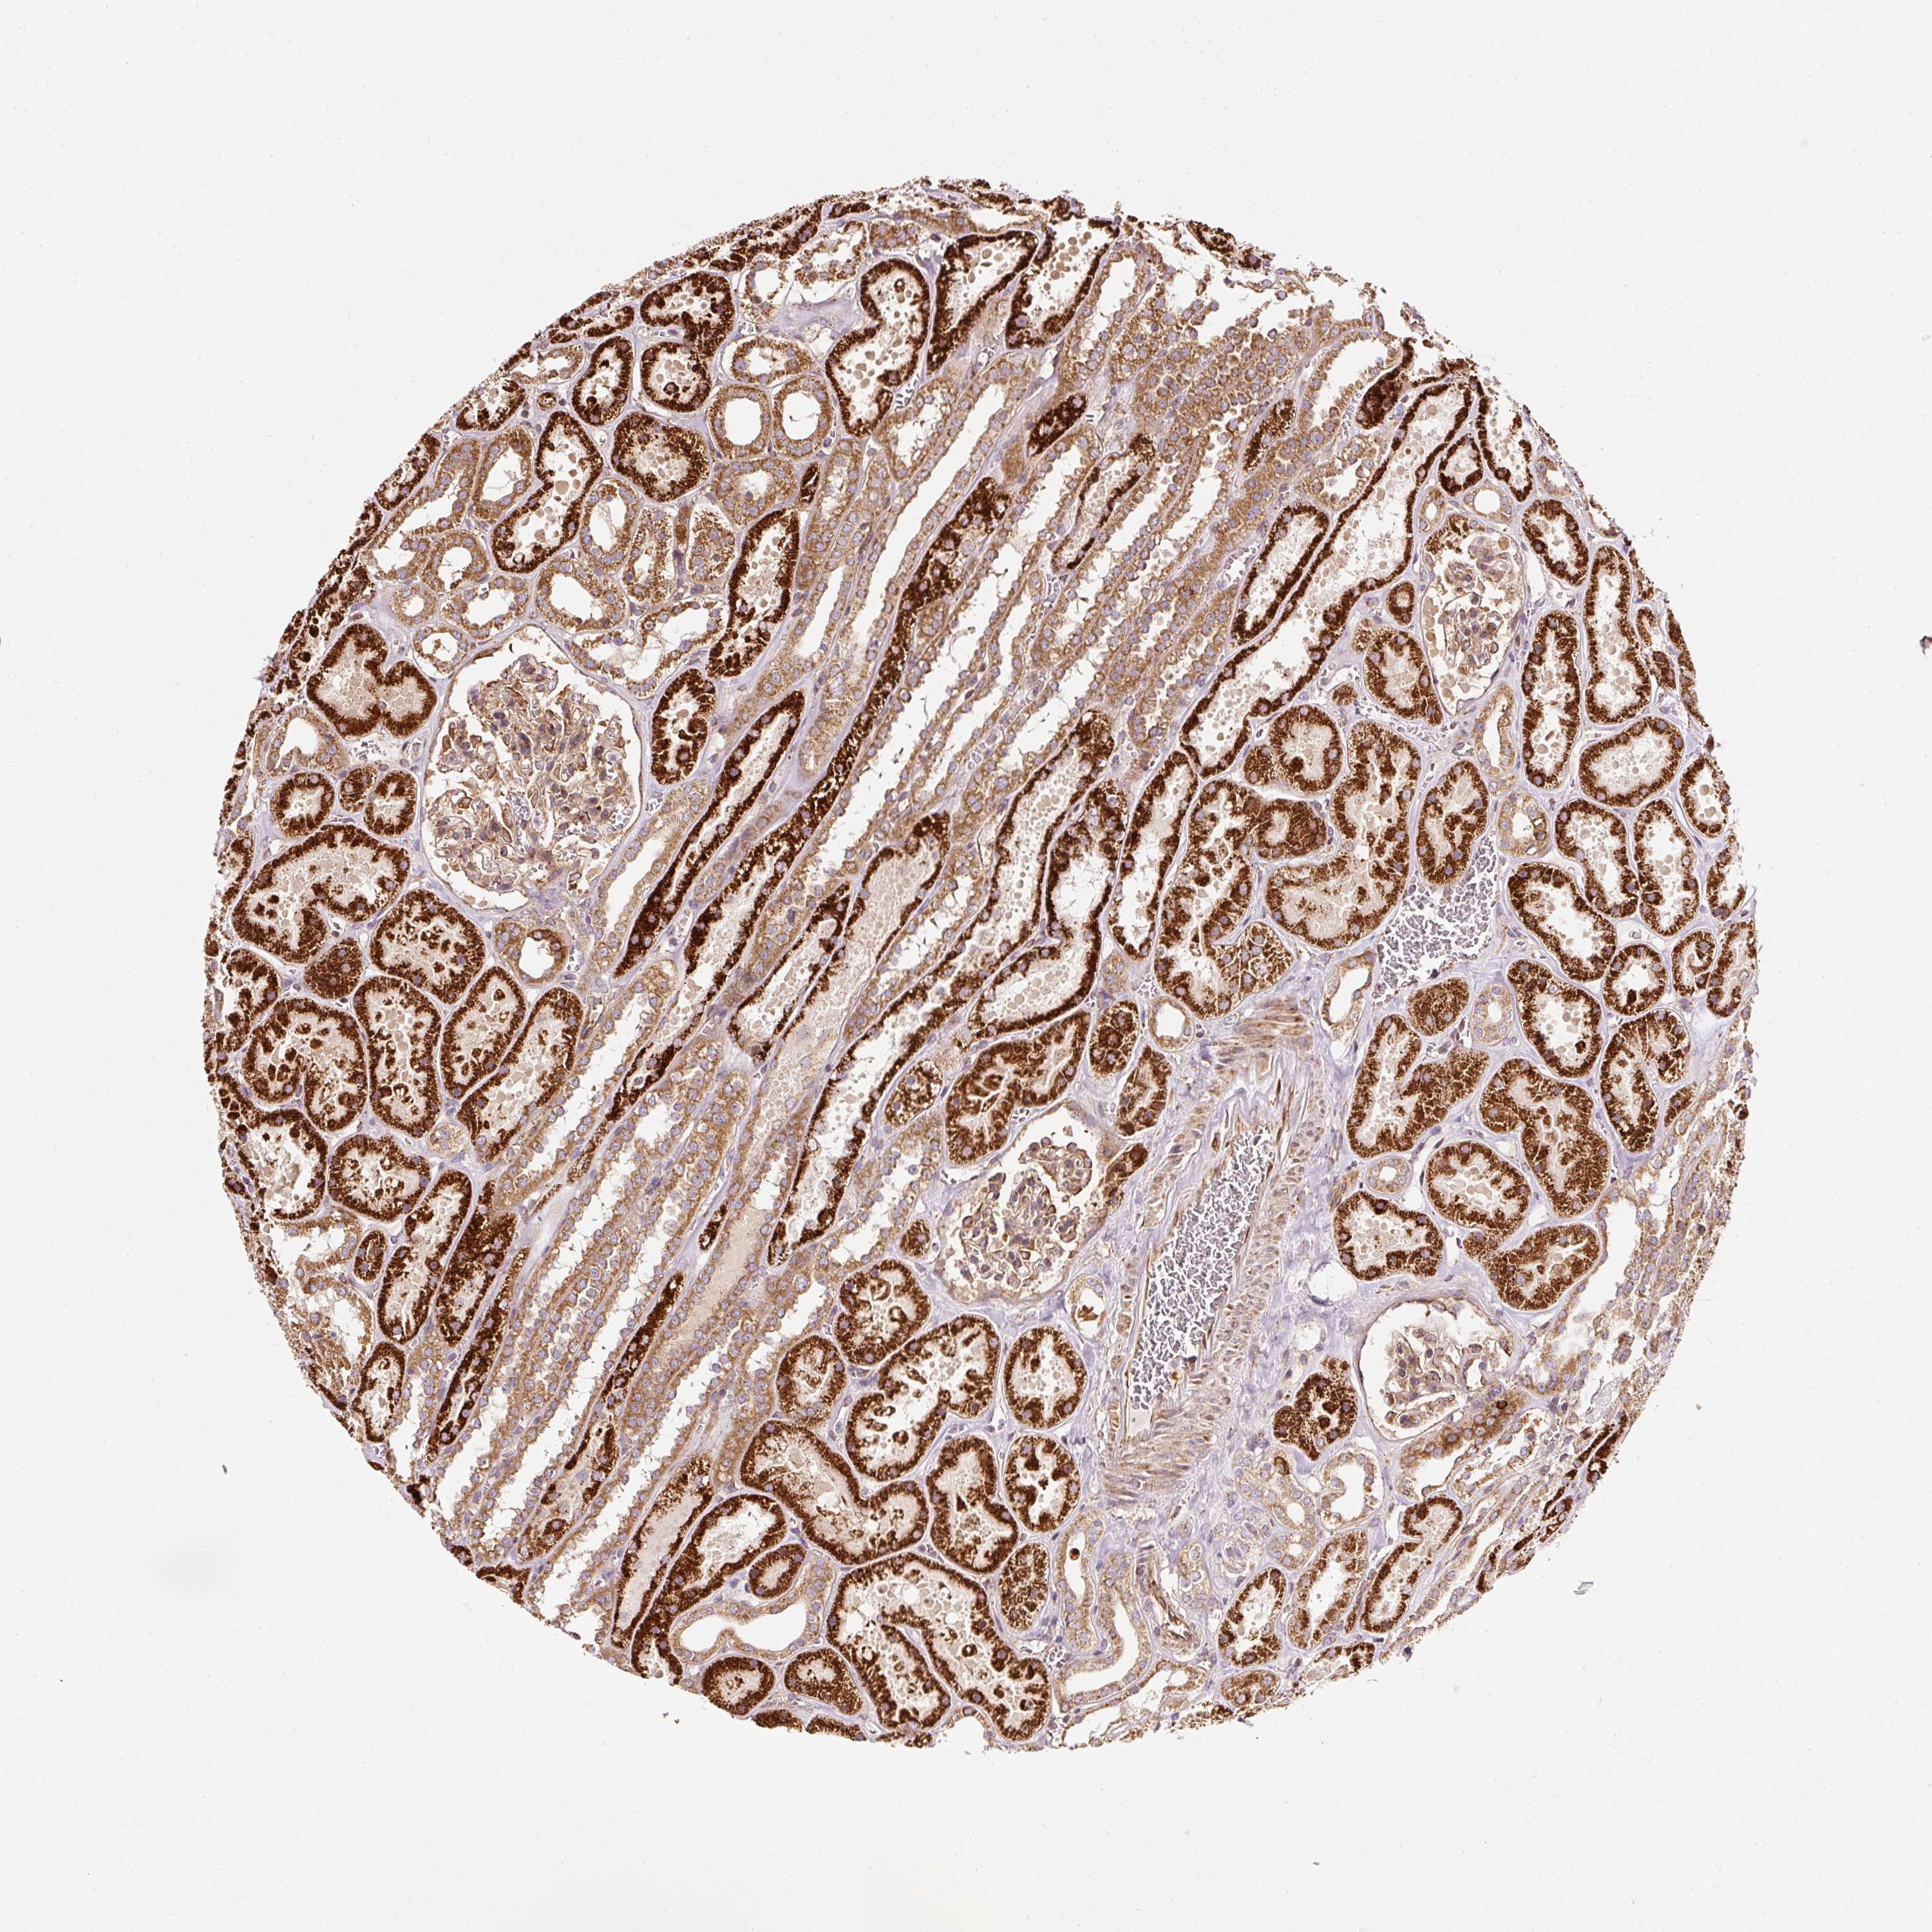
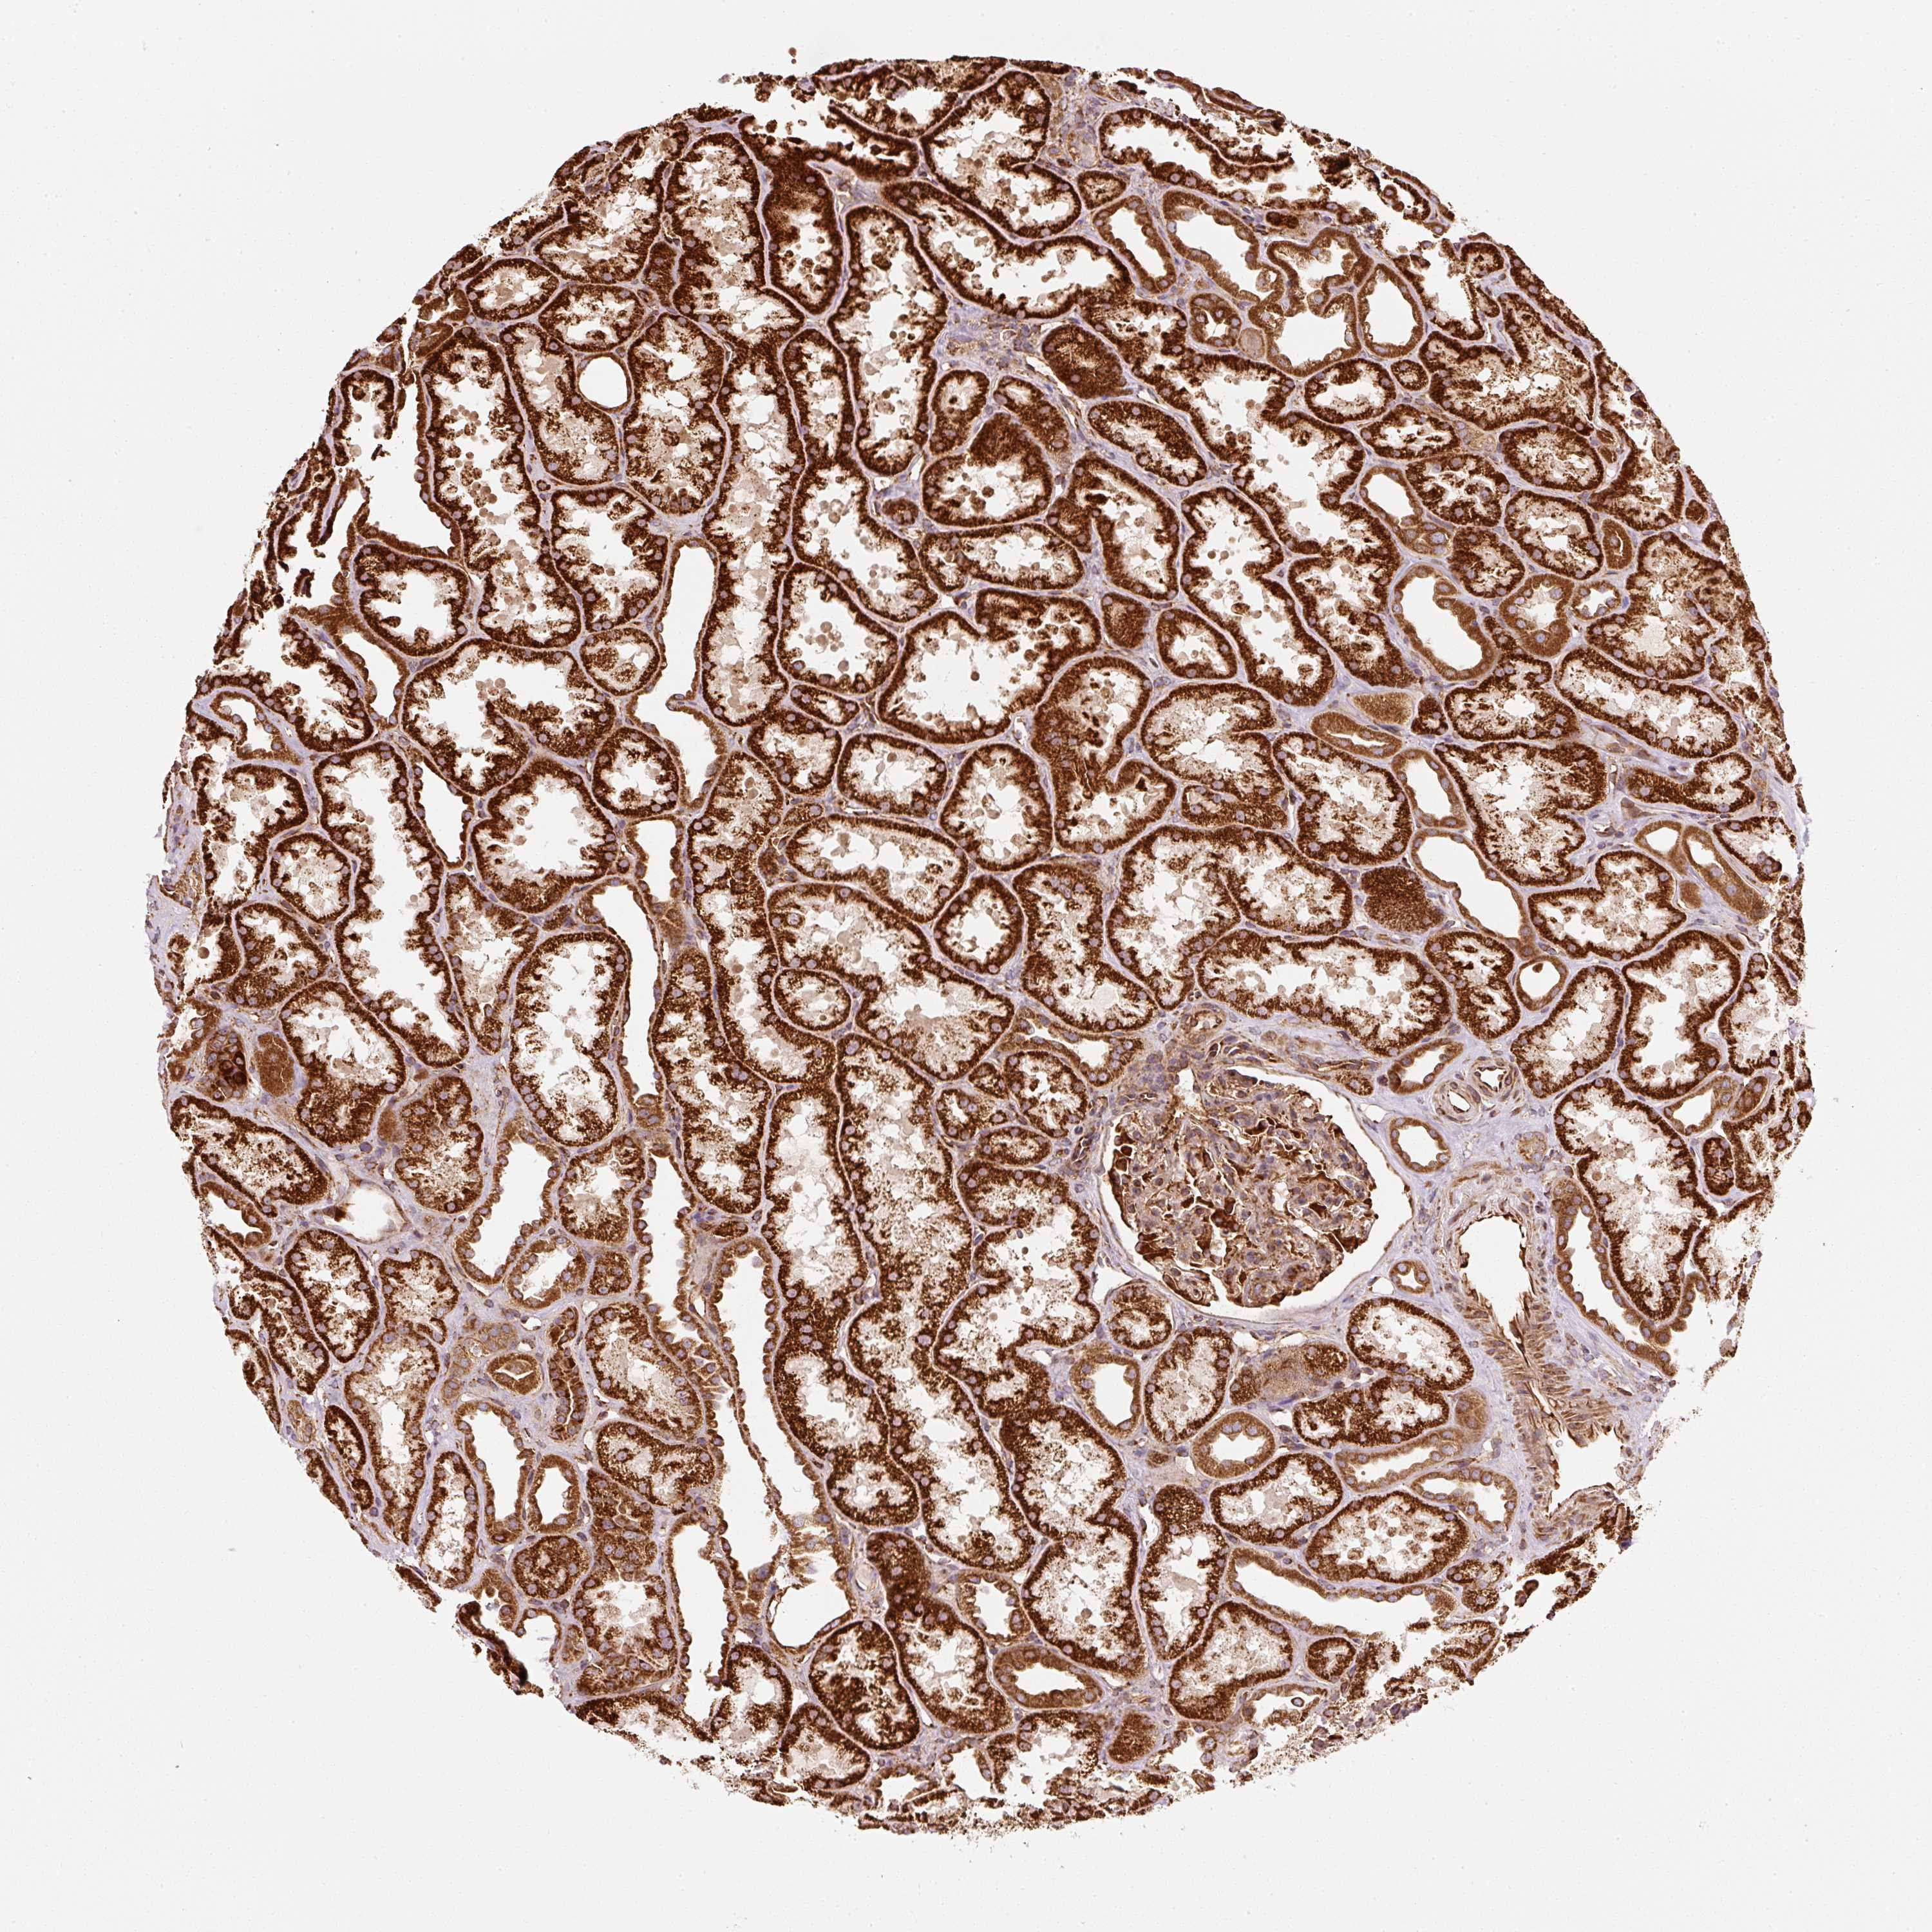
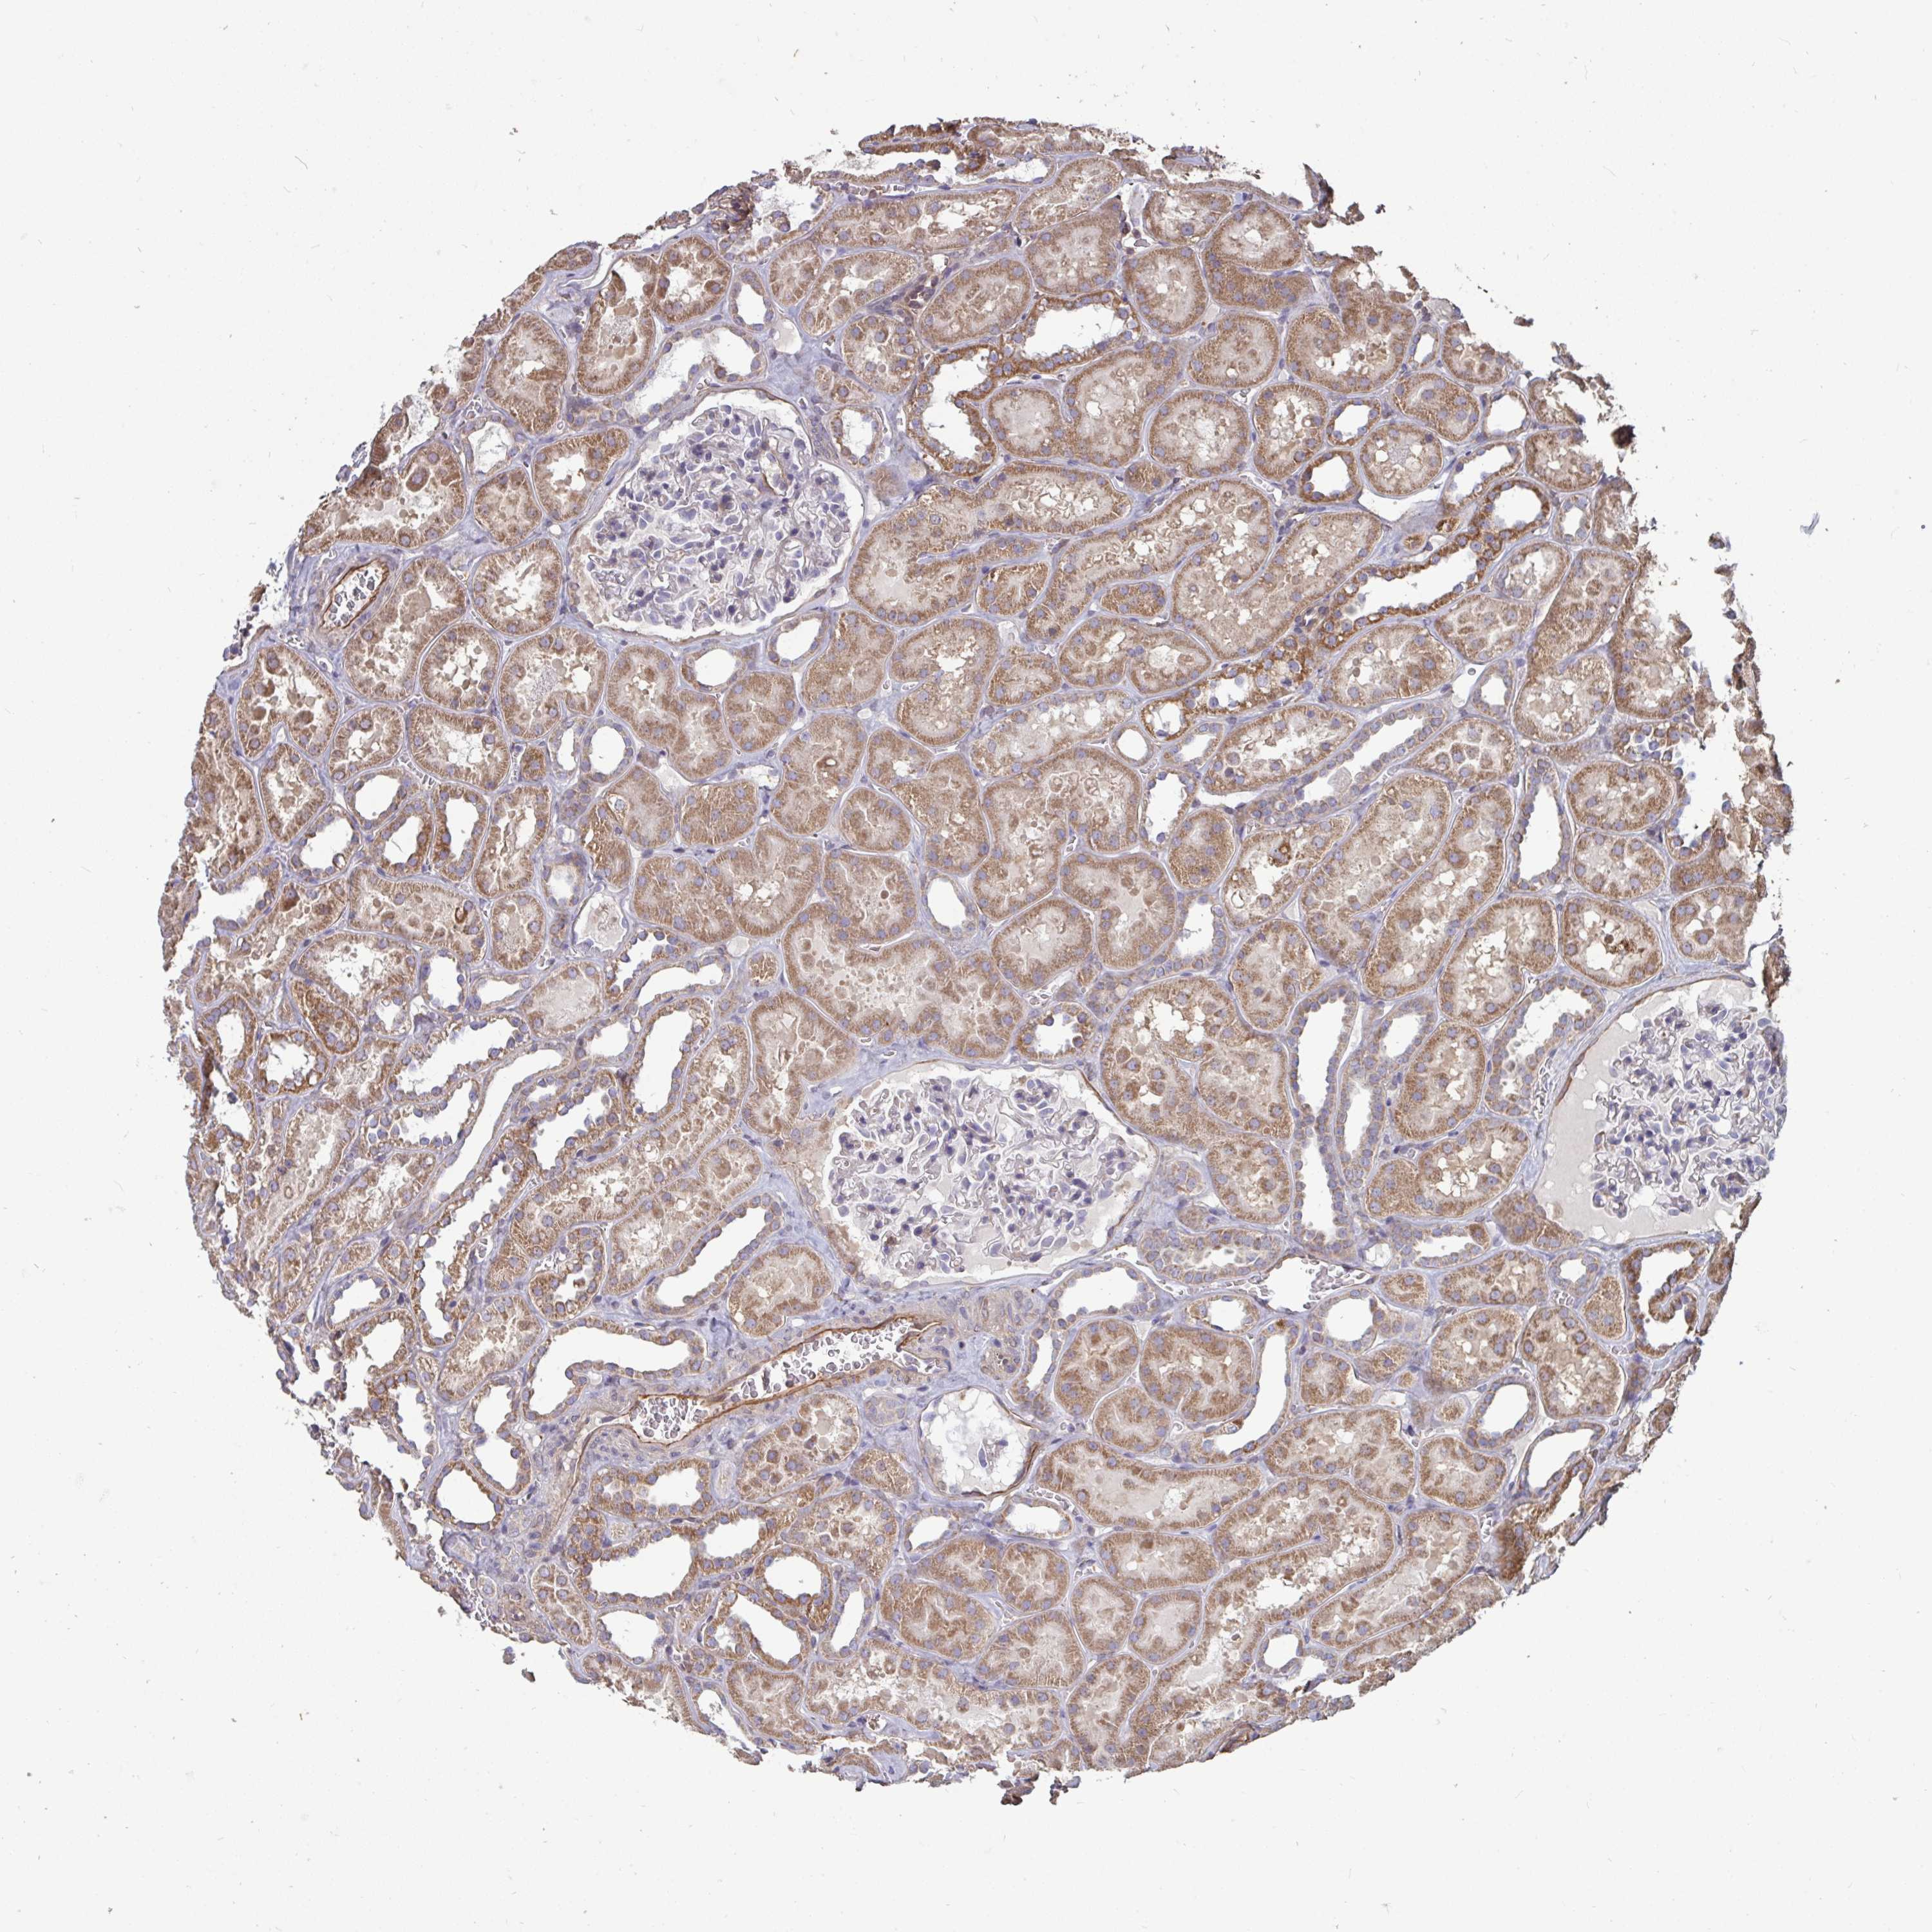
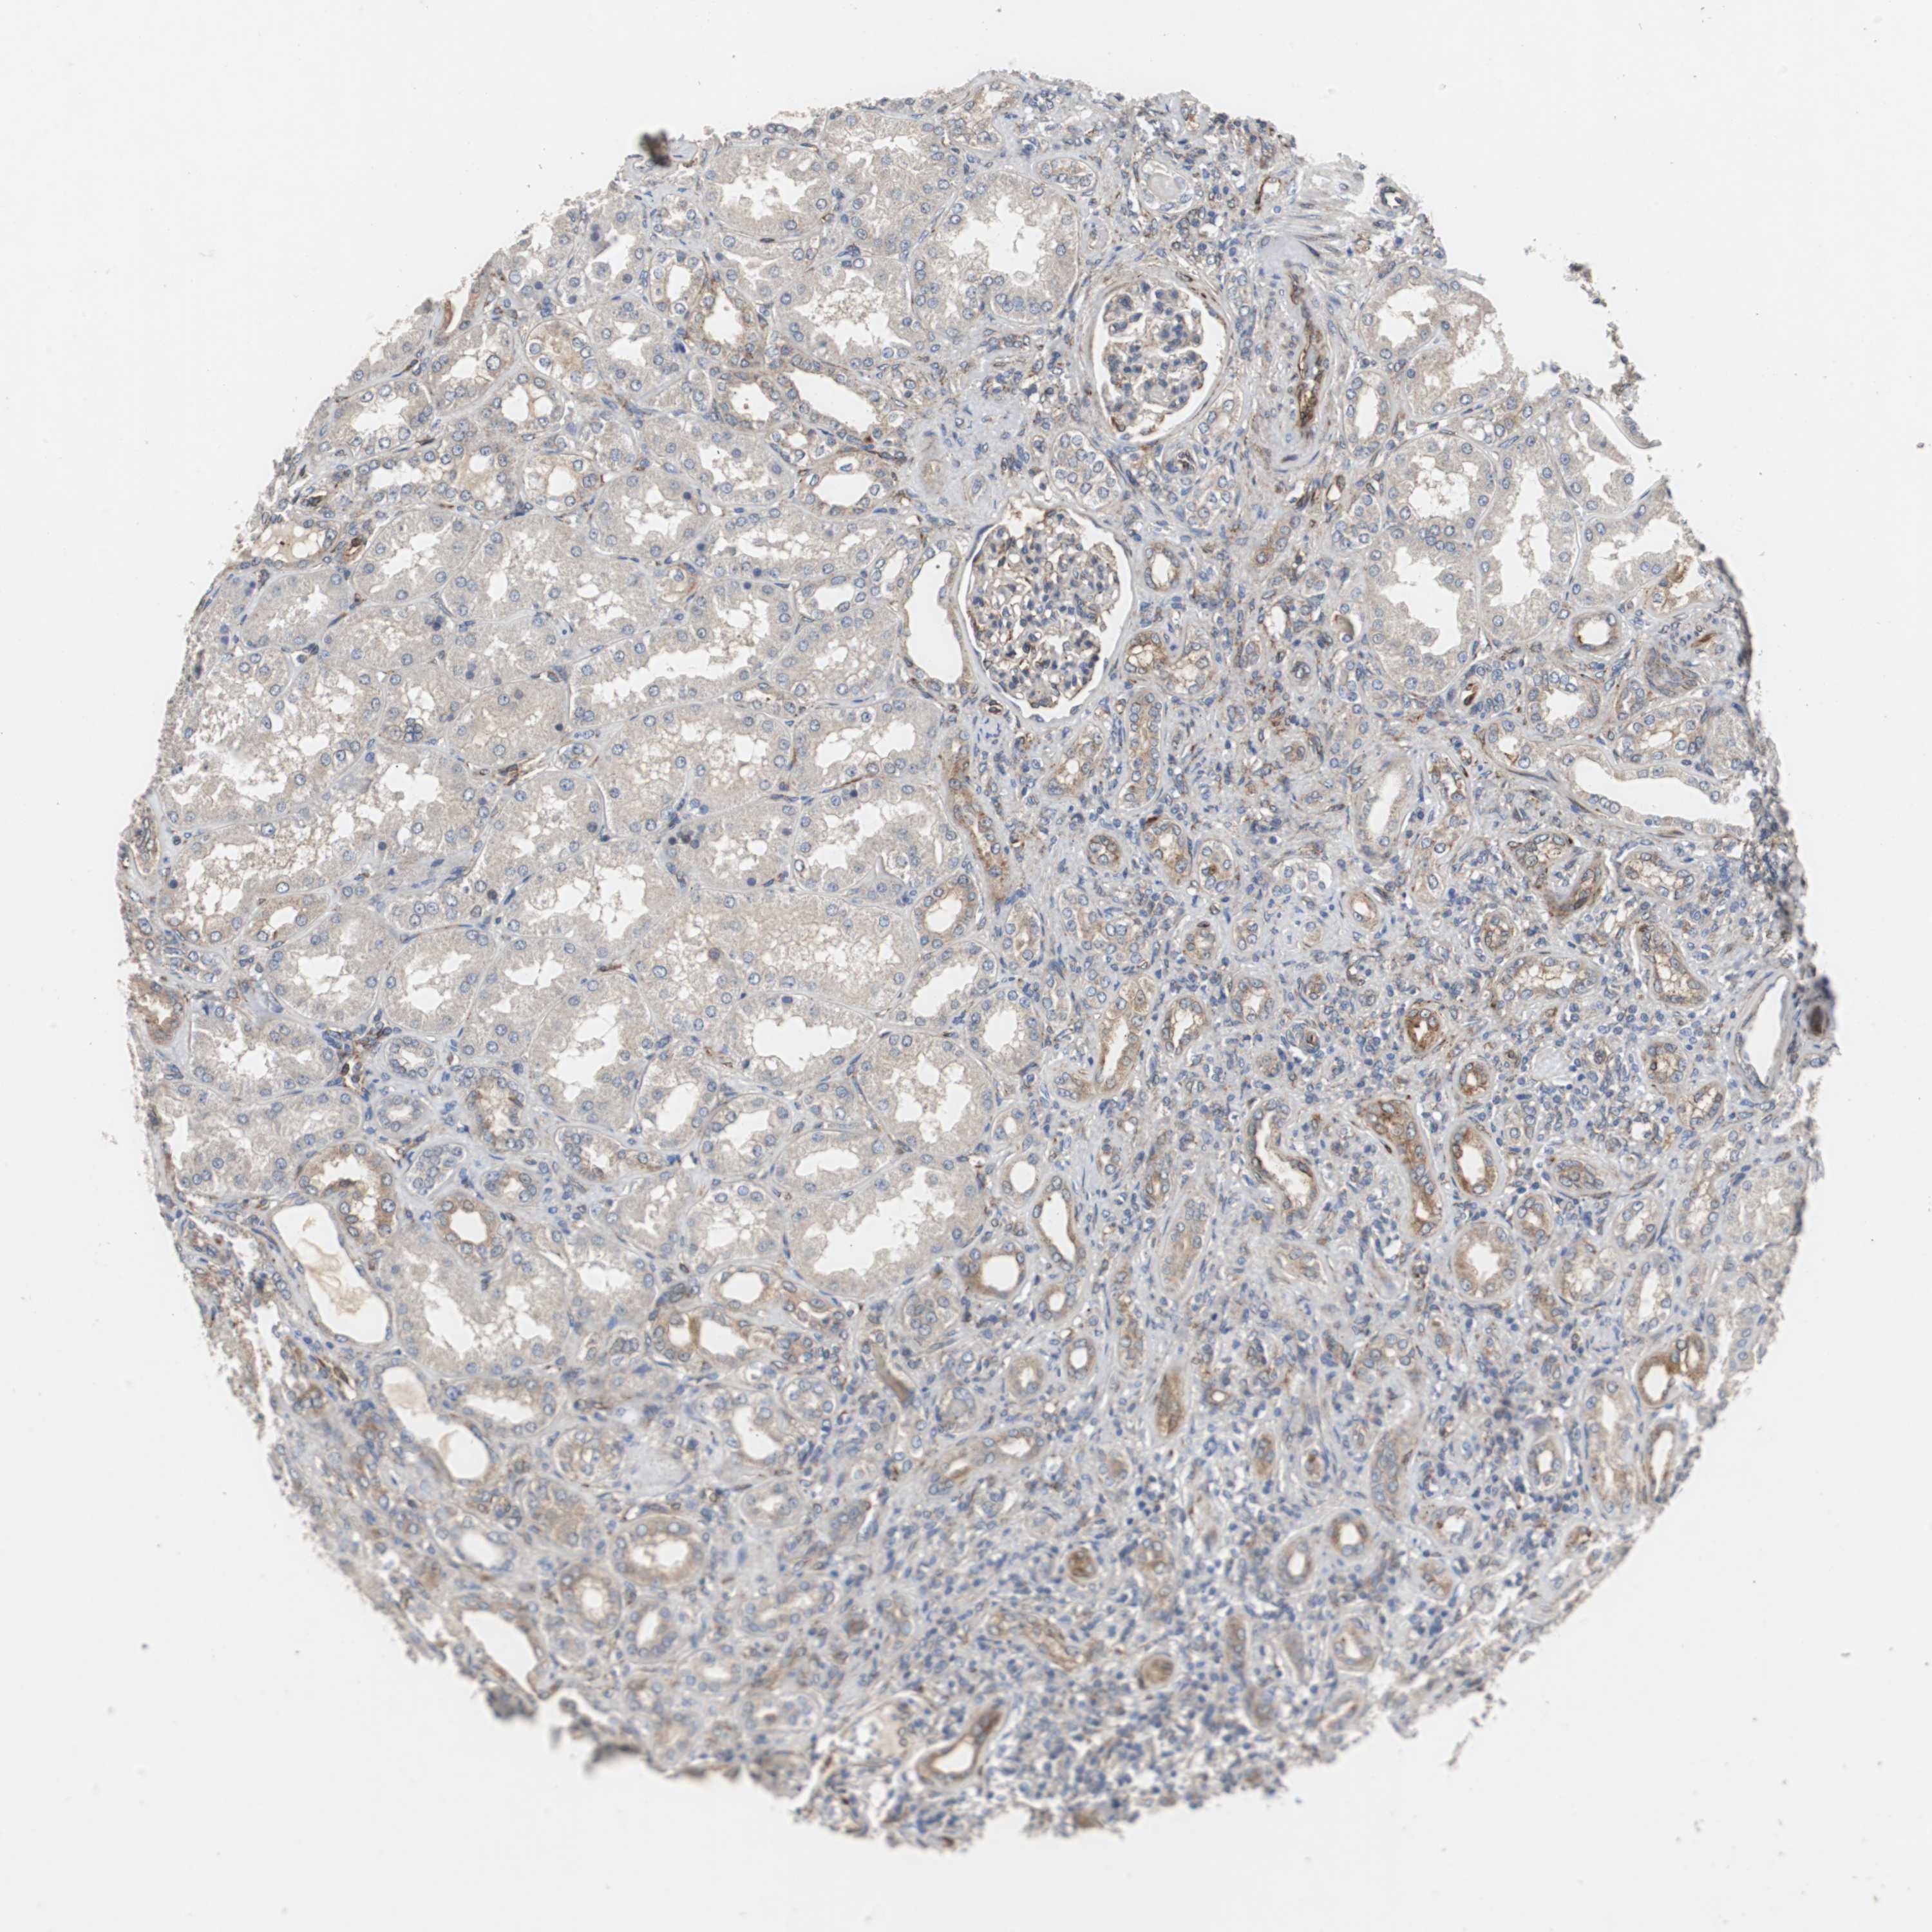
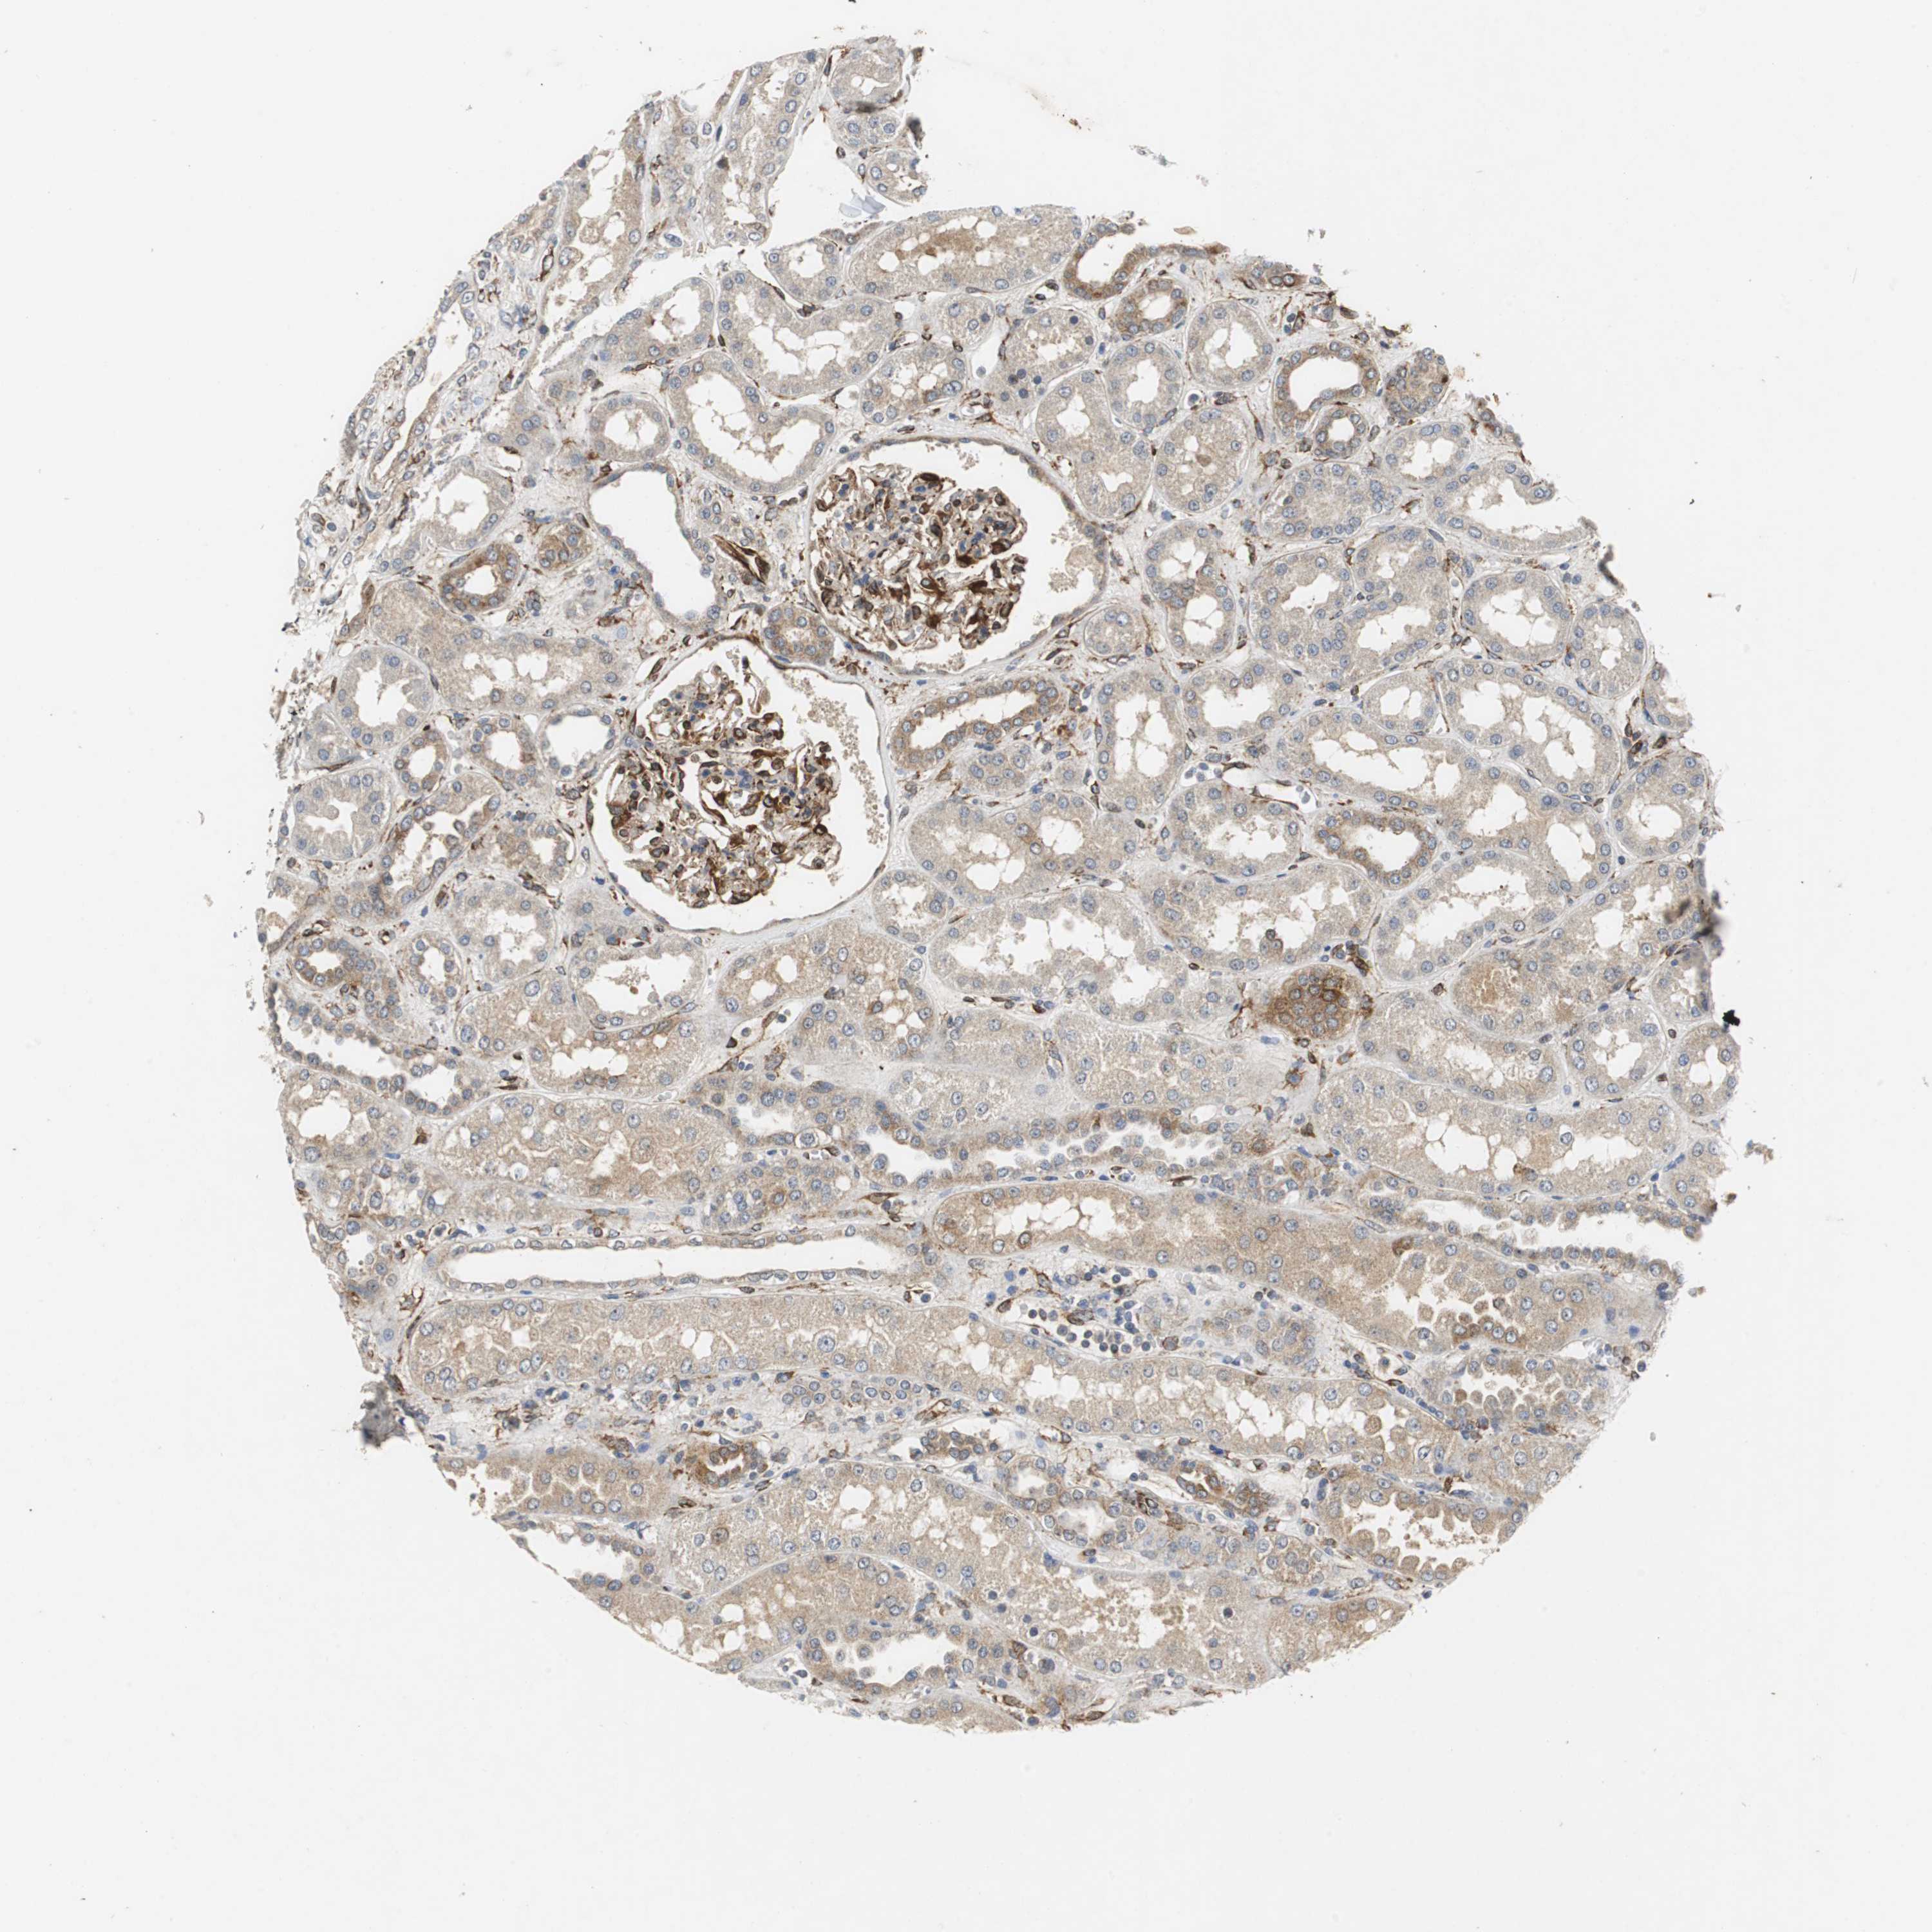
ISCU
Search result
|
TISSUE
PRIMARY DATA
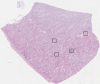
KIDNEY

ANTIBODIES
AND VALIDATION 
Dictionary
Kidney
Tissue proteome
Kidney
Tissue methods

|
|
||||||||||||||||||||||||||||||||||||||||||||||||||||||||||||||||||||||||||||||||||||||||||||||||||||||||||||||||||||||||||||||||||||||||||||||||||||||||||||||||||||||
 The Human Protein Atlas project is funded