RPL10A
Search result
|
TISSUE
PRIMARY DATA
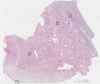
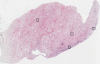
CERVIX

ANTIBODIES
AND VALIDATION 
Dictionary
Cervix
Tissue proteome
Cervix
Tissue methods

|
|
|||||||||||||||||||||||||||||||||||||||||||||||||||||||||||||||||||||||||||||||||||||||||||||||
 The Human Protein Atlas project is funded