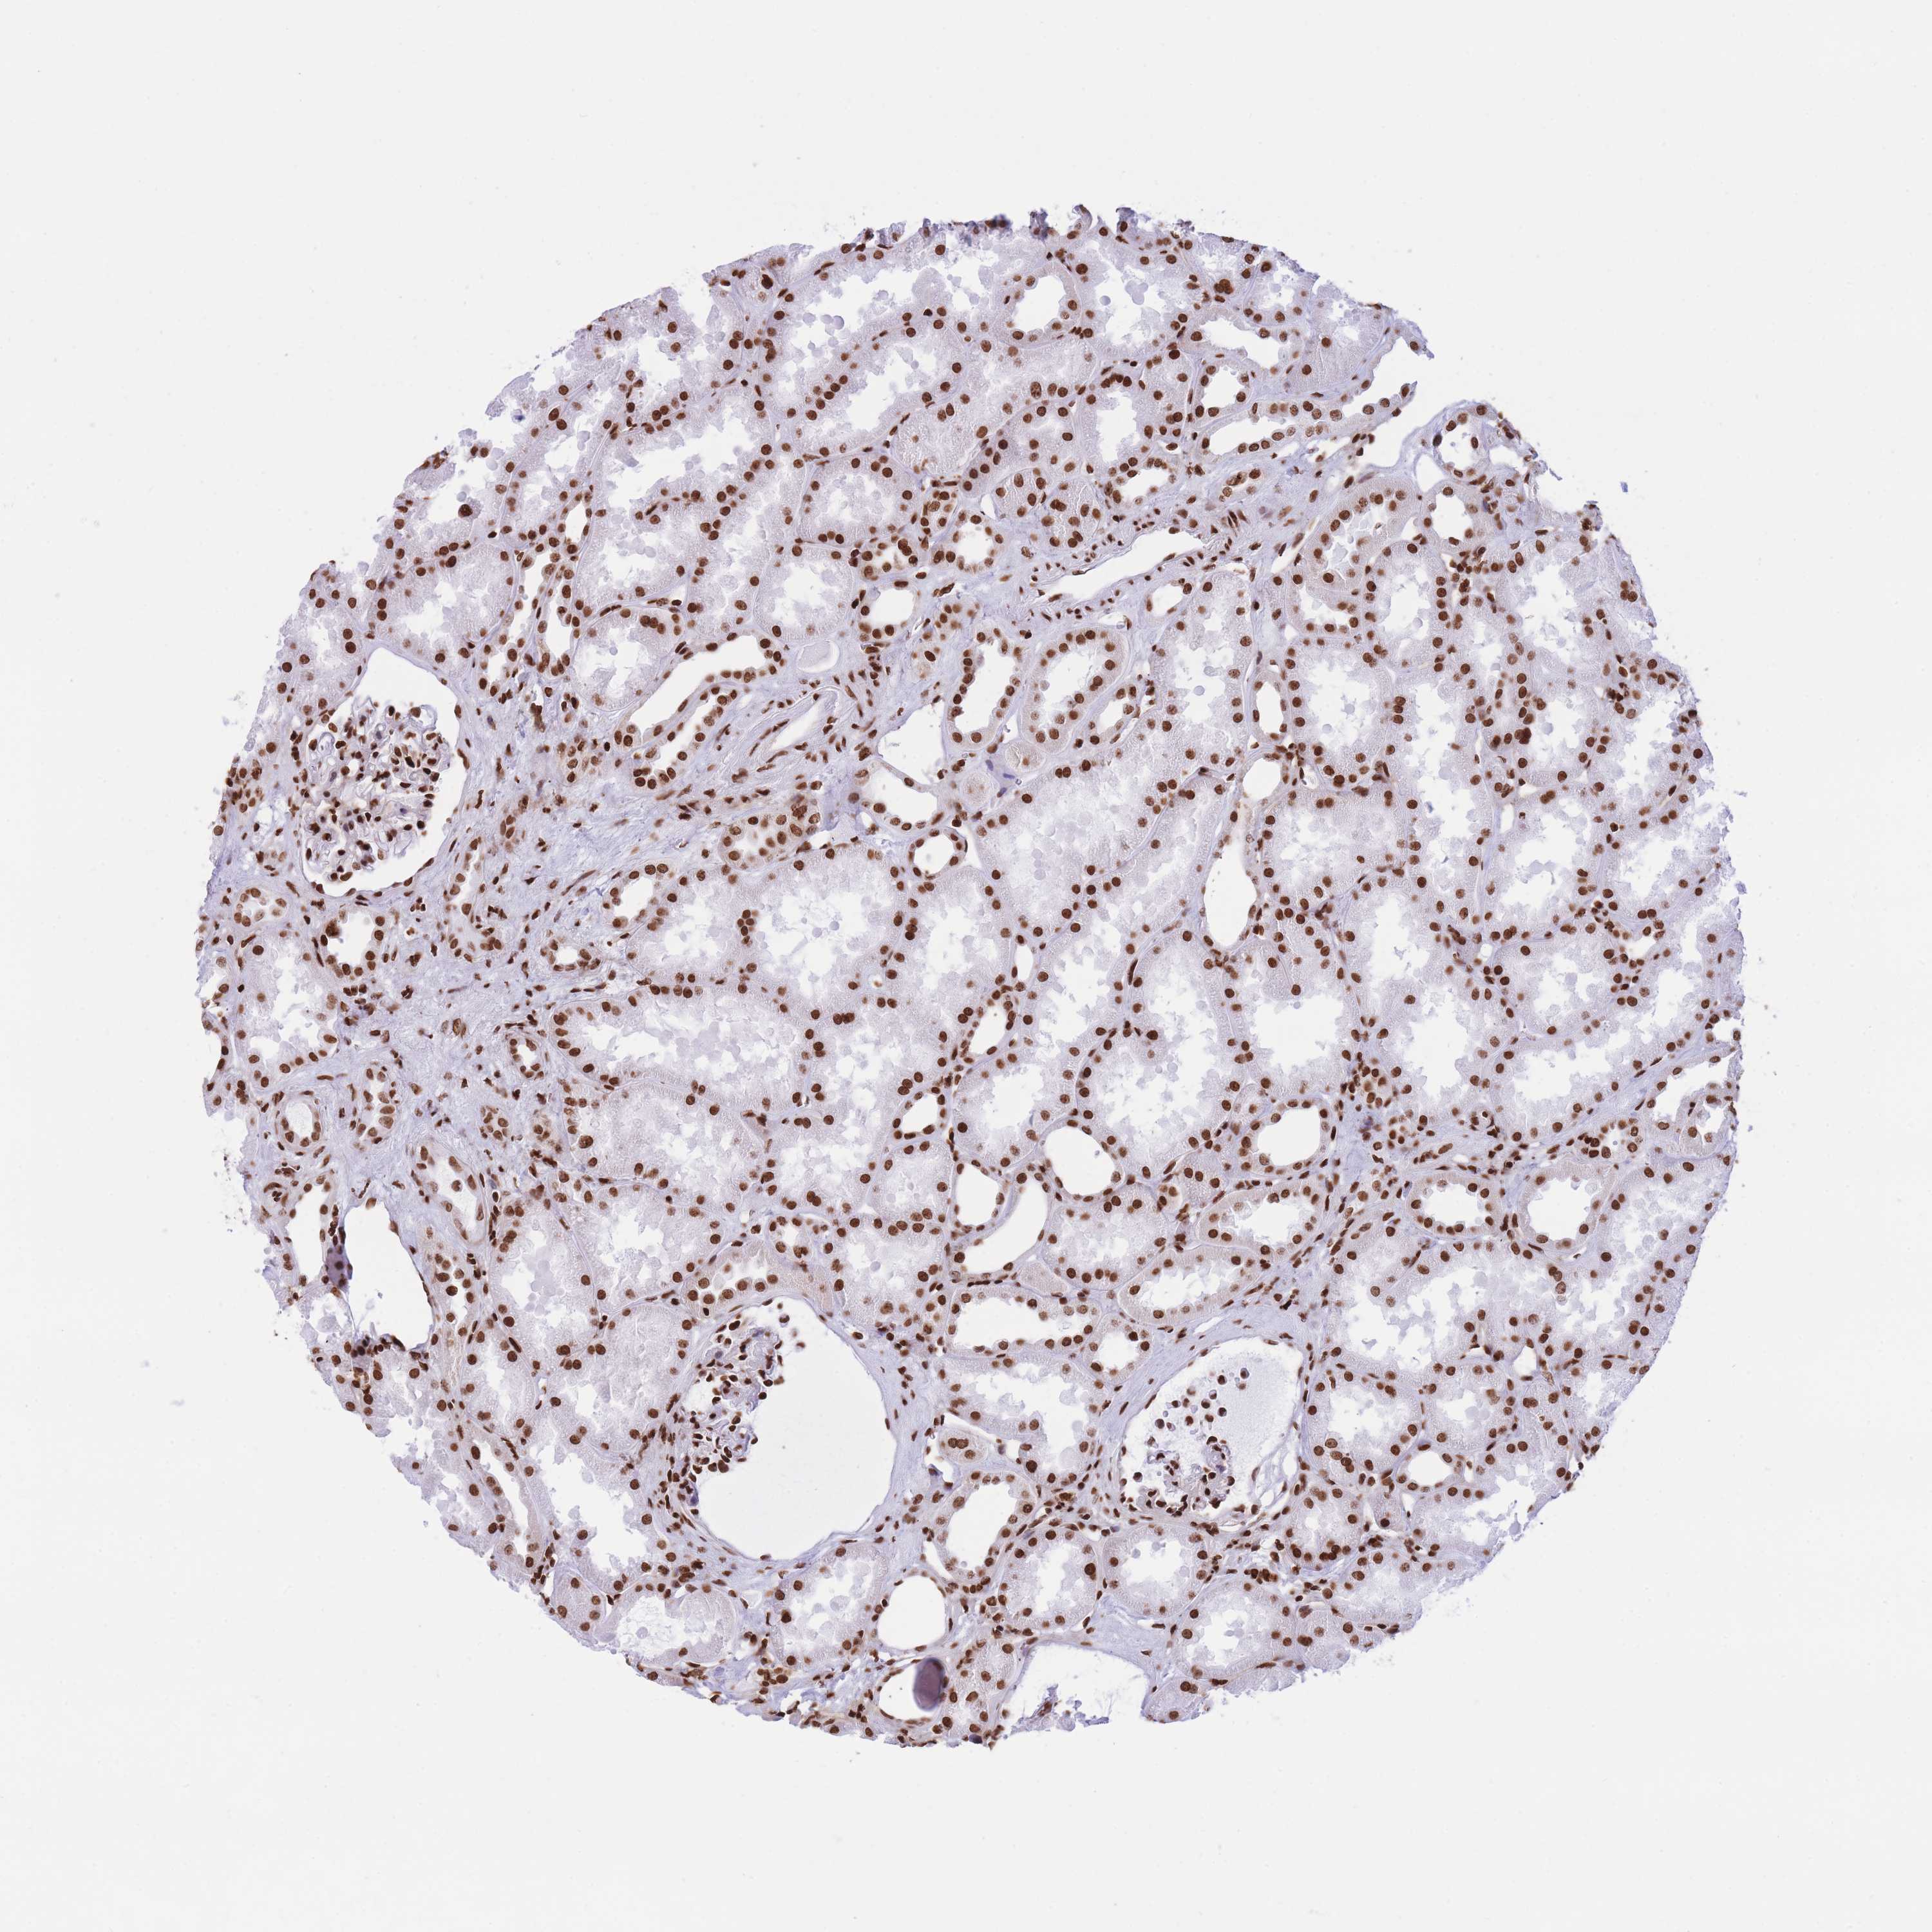
We use cookies to enhance the usability of our website. If you continue, we'll assume that you are happy to receive all cookies. More information. Don't show this again.
H2BC8
HPA
RESOURCES
  • TISSUE
  • BRAIN
  • SINGLE CELL
  • SUBCELLULAR
  • CANCER
  • BLOOD
  • CELL LINE
  • STRUCTURE
  • INTERACTION
ABOUT
  • INTRODUCTION
  • HISTORY
  • ORGANIZATION
  • PUBLICATIONS
  • ACKNOWLEDGMENTS
  • CONTACT
NEWS
  • NEWS ARTICLES
  • PRESS ROOM
LEARN
  • DICTIONARY
  • PROTEIN CLASSES
  • PROTEIN EVIDENCE
  • METHODS
  • EDUCATIONAL VIDEOS
DATA
  • DOWNLOADABLE DATA
  • PUBLICATION DATA
  • RELEASE HISTORY
HELP
  • HELP & FAQ
  • ANTIBODY AVAILABILITY
  • DISCLAIMER
  • PRIVACY STATEMENT
  • LICENCE & CITATION
Fields »
Search result

Field
Term
Gene name
Class
Subclass
Category
Keyword
Chromosome
External id
Tissue
Cell type
Expression
Antibody panel
Tissue
Main location
Patient ID
Annotation
Tissue
Category
Tau score
Cluster
Reliability
Brain region
Category
Tau score
Brain region
Category
Tau score
Brain region
Category
Tau score
Cluster
Reliability
Tissue
Cell type
Enrichment
Cell type
Category
Tau score
Cell type group
Category
Tau score
Cell type
Category
Tau score
Cell type
Category
Tau score
Cell lineage
Category
Tau score
Cluster
Cluster
Location
Searches
Location
Cell line
Class
Type
Phase
Reliability
Cancer
Prognosis
Cancer
Category
Cancer
Category
Tau score
Cluster
Variants
Interacting gene (ensg_id)
Type
Number of interactions
Pathway
ipTM
Category
Category
Category
Category
Validation
Validation
Validation
Validation
Antibodies
Data type
Column


  • SUMMARY

  • TISSUE

  • BRAIN

  • SINGLE CELL

  • SUBCELL

  • CANCER

  • BLOOD

  • CELL LINE

  • STRUCTURE

  • INTERACTION

  • H2BC8
TISSUE PRIMARY DATA KIDNEY Show tissue menu
ADIPOSE TISSUE ADRENAL GLAND AMYGDALA APPENDIX BASAL GANGLIA BLOOD VESSEL BONE MARROW BREAST BRONCHUS CEREBELLUM CEREBRAL CORTEX CERVIX CHOROID PLEXUS COLON
DUODENUM ENDOMETRIUM EPIDIDYMIS ESOPHAGUS FALLOPIAN TUBE GALLBLADDER HEART MUSCLE HIPPOCAMPAL FORMATION HYPOTHALAMUS KIDNEY LIVER LUNG LYMPH NODE MIDBRAIN
NASOPHARYNX ORAL MUCOSA OVARY PANCREAS PARATHYROID GLAND PITUITARY GLAND PLACENTA PROSTATE RECTUM RETINA SALIVARY GLAND SEMINAL VESICLE SKELETAL MUSCLE SKIN
SMALL INTESTINE SMOOTH MUSCLE SOFT TISSUE SPINAL CORD SPLEEN STOMACH TESTIS THYMUS THYROID GLAND TONGUE TONSIL URINARY BLADDER VAGINA
ANTIBODIES
AND
VALIDATION
Dictionary
Kidney
Tissue proteome
Kidney
Tissue methods
KIDNEY - Expression summary
Protein expression
Kidneyi

On the top, protein expression in current human tissue, based on all annotated cell types, is reported with the units not detected (n), low (l), medium (m) and high (h). Underneath, protein expression in each annotated cell type are reported using the same units. Protein expression data is based on knowledge-based annotation. For genes where more than one antibody has been used, a collective score is set. If knowledge-based annotation could not be performed for a gene, no data is displayed here. View antibody staining data further down this page.

h
m
l
n
Cells in glomeruli: High
Cells in tubules: High
RNA expressioni

A summary of mRNA expression data available for current tissue based on several datasets. The mRNA expression levels in human tissues are based on RNA-seq data generated by the Human Protein Atlas HPA, Genotype-Tissue Expression GTEx portal and CAGE data generated by the FANTOM5 consortium. Consensus normalized expression levels for human tissues was created by combining the data from HPA and GTEx datasets. The mRNA expression levels in pig brain are based on RNA-seq data generated by the Human Protein Atlas, and for mouse brain HPA data and in situ hybridization generated by the Allen brain atlas dataset are reported.

Scroll down to view mRNA expression data in more detail.

Consensus:7.2 nTPM
HPA:1.0 nTPM
GTEx:7.2 nTPM
FANTOM5:13.6 Scaled Tags Per Million
KIDNEY - SINGLE CELL RNA EXPRESSION
Explore single cell type data

KIDNEY - Antibody stainingi

Antibody staining in the annotated cell types in the current human tissue is reported as not detected, low, medium, or high, based on conventional immunohistochemistry profiling in selected tissues. This score is based on the combination of the staining intensity and fraction of stained cells. Each image is clickable and will lead to virtual microscopy that enables deeper exploration of all samples and also displays staining intensity scores, fraction scores and subcellular localization as well as patient and tissue information for each sample.

Ascending and descending describe two types of gradient, based on difference in staining intensity between enterocytes in crypts and apical enterocytes.

Ascending - the staining intensity is stronger in apical enterocytes (towards the lumen) compared to enterocytes in the crypts (gland based)

Descending - the staining is weaker in apical enterocytes compared to enterocytes in crypts

Antibody HPA042205Antibody HPA043013Antibody HPA048671
Cells in glomeruli HighHighMedium
Cells in tubules HighHighMedium


KIDNEY - HPA RNA-seqi

The RNA-seq details section shows detailed information about the individual samples used for the transcript profiling and results of the RNA-seq analysis.

Information about each individual sample is listed below, including gender, age, a tissue section image and estimated fractions of cell types. nTPM (normalized transcripts per million) values give a quantification of the gene abundance which is comparable between different genes and samples.

Average nTPMi

Max subtype nTPM is the value for the subtype with the largest average nTPM across the subtype samples.

1.0
overview
Female, age 58
Kidney sample 55
nTPM: 0.4
Cell types%
Cells in tubules:
60

Cells in glomeruli:
20

Fibroblasts:
5

Other cell types:
15

overview
Female, age 67
Kidney sample 56
nTPM: 0.3
Cell types%
Cells in tubules:
70

Cells in glomeruli:
15

Fibroblasts:
10

Other cell types:
5

overview
Female, age 55
Kidney sample 57
nTPM: 2.6
Cell types%
Cells in tubules:
80

Cells in glomeruli:
10

Fibroblasts:
5

Other cell types:
5

overview
Male, age 46
Kidney sample 58
nTPM: 0.4
Cell types%
Cells in tubules:
60

Cells in glomeruli:
25

Fibroblasts:
5

Other cell types:
10

overview
Female, age 57
Kidney sample 358
nTPM: 0.8
Cell types%
Cells in tubules:
60

Cells in glomeruli:
10

Fibroblasts:
10

Other cell types:
20

overview
Male, age 78
Kidney sample 377
nTPM: 2.1
Cell types%
Cells in tubules:
65

Cells in glomeruli:
10

Fibroblasts:
5

Other cell types:
20

overview
Male, age 73
Kidney sample 380
nTPM: 1
Cell types%
Cells in tubules:
60

Cells in glomeruli:
10

Fibroblasts:
10

Other cell types:
20

overview
Female, age 59
Kidney sample 394
nTPM: 0.7
Cell types%
Cells in tubules:
65

Cells in glomeruli:
10

Fibroblasts:
10

Other cell types:
15

overview
Female, age 48
Kidney sample 414
nTPM: 0.9
Cell types%
Cells in tubules:
60

Cells in glomeruli:
5

Fibroblasts:
10

Other cell types:
25


KIDNEY - GTEx RNA-seqi

RNA-Seq data generated by the Genotype-Tissue Expression (GTEx) project from human tissues is reported as mean nTPM. More information can be found on the GTEx portal.

Distribution across the dataset is visualized with box plots, shown as median and 25th and 75th percentiles. Points are displayed as outliers if they are above or below 1.5 times the interquartile range. nTPM values of the individual samples are presented next to the box plot.

Max subtype nTPMi

Max subtype nTPM is the value for the subtype with the largest average nTPM across the subtype samples.

7.2
GTEx sample id Sample description nTPM
Kidney - Cortex
Average nTPM: 5.2
Samples: 104

Max nTPM: 40.5
Min nTPM: 0.0
Std nTPM: 5.9
Median nTPM: 3.5
GTEX-1JMQK-1926-SM-CJI3B 60-69 years, male 40.5
GTEX-1E2YA-1626-SM-7MGXS 50-59 years, male 35.2
GTEX-1HB9E-1826-SM-D4P33 50-59 years, male 17.0
GTEX-1C6VQ-2326-SM-7IGN1 50-59 years, male 15.7
GTEX-ZYT6-2226-SM-5GIC9 30-39 years, male 14.5
GTEX-1IL2V-1826-SM-ARU7R 70-79 years, male 14.3
GTEX-ZDXO-0226-SM-4WKH7 60-69 years, male 14.0
GTEX-13O1R-2526-SM-5N9FW 60-69 years, male 11.9
GTEX-ZE9C-1426-SM-4WKGM 60-69 years, male 11.9
GTEX-147F4-2626-SM-5Q5CS 50-59 years, male 11.5
GTEX-1N2DW-1826-SM-EAZ54 50-59 years, male 10.9
GTEX-15DCD-1926-SM-HAV33 70-79 years, female 10.8
GTEX-1A8FM-2026-SM-7P8RN 50-59 years, female 10.6
GTEX-12WSG-0826-SM-5EQ5A 50-59 years, female 10.5
GTEX-QDT8-1726-SM-EYYV6 30-39 years, female 10.2
GTEX-11TTK-1926-SM-5PNW8 60-69 years, female 9.5
GTEX-1PWST-2226-SM-EVR3G 70-79 years, male 9.4
GTEX-16XZY-1026-SM-HAV39 70-79 years, male 8.1
GTEX-1J1OQ-1426-SM-AHZ3P 40-49 years, female 8.1
GTEX-1ICLY-2026-SM-GA913 50-59 years, male 7.7
GTEX-15DYW-2026-SM-6AJBD 60-69 years, female 7.6
GTEX-11OF3-1326-SM-5N9FJ 60-69 years, male 7.3
GTEX-13112-2126-SM-5GCO4 50-59 years, male 7.1
GTEX-13OVL-1826-SM-5KLZR 50-59 years, male 7.1
GTEX-1JJE9-1026-SM-HL9TH 70-79 years, male 7.0
GTEX-RN64-1626-SM-48FD7 50-59 years, male 6.9
GTEX-16Z82-2826-SM-HAUZZ 60-69 years, male 6.8
GTEX-12696-0926-SM-5FQTV 60-69 years, male 6.6
GTEX-1HBPI-2026-SM-CE6RZ 50-59 years, male 6.5
GTEX-16MT8-1926-SM-7EPGL 60-69 years, female 6.4
GTEX-W5X1-1626-SM-H7OGO 40-49 years, female 6.3
GTEX-1A3MW-2226-SM-73KUX 60-69 years, female 6.2
GTEX-1N2EF-1426-SM-EXUSH 60-69 years, male 5.9
GTEX-13NYB-1726-SM-5N9G2 40-49 years, male 5.6
GTEX-1I1GP-1926-SM-CNNQU 50-59 years, male 5.3
GTEX-1GN1U-2126-SM-AHZ4J 50-59 years, female 5.0
GTEX-1JMQJ-1726-SM-E9U4V 50-59 years, male 4.9
GTEX-1KWVE-0826-SM-CXZKO 30-39 years, male 4.9
GTEX-1RQEC-2426-SM-F2I1J 60-69 years, male 4.5
GTEX-O5YV-1226-SM-EV795 60-69 years, female 4.4
GTEX-17F97-1926-SM-7IGM4 50-59 years, male 4.3
GTEX-1HCVE-2126-SM-HL9UO 50-59 years, male 4.2
GTEX-1BAJH-1826-SM-731DA 70-79 years, male 4.1
GTEX-1H3NZ-2126-SM-9WPQ6 60-69 years, male 4.1
GTEX-13OW6-1826-SM-5N9F9 50-59 years, male 4.0
GTEX-1GF9W-1326-SM-7P8PX 60-69 years, male 3.9
GTEX-14C5O-2026-SM-5YYB1 60-69 years, male 3.7
GTEX-1EKGG-2226-SM-7IGOA 60-69 years, male 3.7
GTEX-1JMLX-1526-SM-AHZ3N 50-59 years, male 3.7
GTEX-1K9T9-1826-SM-CXZK2 50-59 years, female 3.7
GTEX-1IKK5-0926-SM-A9G2U 60-69 years, male 3.6
GTEX-14E6D-2526-SM-5YYA9 50-59 years, male 3.5
GTEX-16XZZ-2226-SM-HAV34 60-69 years, male 3.5
GTEX-17HHY-2326-SM-7KFSR 50-59 years, male 3.5
GTEX-NFK9-1826-SM-HL9T3 40-49 years, male 3.5
GTEX-15CHQ-2126-SM-6871M 60-69 years, male 3.4
GTEX-1R9PO-1626-SM-E6CPT 60-69 years, female 3.4
GTEX-ZXG5-2026-SM-HAUZV 60-69 years, male 3.4
GTEX-1HCU7-1826-SM-A9G2A 50-59 years, male 3.3
GTEX-WL46-1926-SM-GNIN6 50-59 years, male 3.2
GTEX-17F96-1926-SM-7MGWY 70-79 years, male 3.0
GTEX-1LH75-1326-SM-F2I1R 50-59 years, female 2.9
GTEX-14PJ2-1826-SM-HL9UB 50-59 years, male 2.8
GTEX-S33H-1426-SM-EZ6L7 30-39 years, male 2.8
GTEX-1NV8Z-2226-SM-EXOJ2 60-69 years, male 2.5
GTEX-T6MN-1826-SM-EXOHN 50-59 years, male 2.5
GTEX-1AX8Z-2326-SM-731CR 60-69 years, male 2.4
GTEX-ZC5H-1726-SM-5HL7X 40-49 years, female 2.3
GTEX-13RTJ-2226-SM-5S2Q1 60-69 years, male 2.1
GTEX-1F48J-2226-SM-7MXTN 50-59 years, female 2.1
GTEX-1GF9V-1926-SM-9JGHE 60-69 years, male 2.1
GTEX-1O9I2-1926-SM-F2TBQ 50-59 years, male 2.1
GTEX-ZLFU-0926-SM-5P9F8 40-49 years, male 2.1
GTEX-13O3O-1726-SM-GJ3RL 60-69 years, female 2.0
GTEX-14JG1-2326-SM-HAUZ5 40-49 years, male 2.0
GTEX-1117F-2126-SM-GIN9G 60-69 years, female 1.7
GTEX-1497J-0826-SM-5NQAJ 60-69 years, male 1.6
GTEX-11GS4-2326-SM-5A5KS 60-69 years, male 1.5
GTEX-1H3VY-1926-SM-9JGHJ 50-59 years, male 1.4
GTEX-1OJC4-2326-SM-DTXA5 50-59 years, female 1.4
GTEX-REY6-1826-SM-EAZAT 60-69 years, male 1.4
GTEX-1GTWX-1826-SM-9QEHG 60-69 years, male 1.3
GTEX-1QP6S-1526-SM-EXUSG 40-49 years, male 1.3
GTEX-QLQW-1626-SM-CMKFE 30-39 years, male 1.3
GTEX-1GMR3-2426-SM-7MXV2 40-49 years, male 1.2
GTEX-1MUQO-2526-SM-E9TJN 60-69 years, male 1.2
GTEX-ZVZP-0926-SM-5GIDB 50-59 years, male 1.1
GTEX-1CB4J-1926-SM-7MGX8 60-69 years, male 1.0
GTEX-1JMPZ-1226-SM-ARU8Y 30-39 years, male 1.0
GTEX-1LG7Y-2726-SM-D5OVW 50-59 years, male 0.9
GTEX-Y5V5-1226-SM-EYYVP 60-69 years, female 0.9
GTEX-Y5V6-2026-SM-5IFHO 60-69 years, male 0.9
GTEX-1399S-0526-SM-5IJG8 30-39 years, female 0.7
GTEX-13OVI-1126-SM-5KLZF 60-69 years, female 0.7
GTEX-1JJ6O-2526-SM-AHZ3J 60-69 years, male 0.6
GTEX-T5JC-1526-SM-4DM68 20-29 years, male 0.6
GTEX-145MN-0326-SM-5QGQI 30-39 years, male 0.4
GTEX-P4QS-1126-SM-3NMD5 60-69 years, male 0.4
GTEX-14C39-2126-SM-664OH 40-49 years, male 0.3
GTEX-XPVG-0526-SM-4B65N 50-59 years, male 0.3
GTEX-ZYFG-1626-SM-5GZYY 60-69 years, female 0.2
GTEX-1QAET-2126-SM-F2TBS 50-59 years, male 0.1
GTEX-QDVN-1726-SM-HL9TO 50-59 years, male 0.1
GTEX-13FHP-2126-SM-GIN8J 50-59 years, male 0.0
Show allShow less
Kidney - Medulla
Average nTPM: 7.2
Samples: 11

Max nTPM: 22.8
Min nTPM: 1.1
Std nTPM: 6.1
Median nTPM: 5.4
GTEX-SIU8-1926-SM-H7OG4 50-59 years, male 22.8
GTEX-S33H-1526-SM-GQ1CB 30-39 years, male 15.0
GTEX-R55E-2026-SM-EZ6L1 20-29 years, male 8.6
GTEX-T6MN-1926-SM-GOQYD 50-59 years, male 7.2
GTEX-QEG4-1526-SM-GPRWK 30-39 years, male 5.7
GTEX-T5JC-1626-SM-EZ6KW 20-29 years, male 5.4
GTEX-RU72-1926-SM-EAZ3F 50-59 years, female 5.3
GTEX-QEG5-2026-SM-H6Q6I 20-29 years, male 4.0
GTEX-TKQ2-0626-SM-EZ6LB 50-59 years, male 2.6
GTEX-N7MS-1526-SM-HAUZP 60-69 years, male 1.2
GTEX-P4QS-1226-SM-HPAG8 60-69 years, male 1.1
Show allShow less

KIDNEY - FANTOM5 CAGEi

RNA expression in human tissues obtained through Cap Analysis of Gene Expression (CAGE) generated by the FANTOM5 project are reported as Scaled Tags Per Million.

Max subtype Scaled Tags Per Millioni

Max subtype Scaled Tags Per Million is the value for the subtype with the largest average Scaled Tags Per Million across the subtype samples.

13.6
FANTOM5 sample id Sample description Scaled Tags Per Million
Kidney
Scaled Tags Per Million: 13.6
FF:10017-101C8 60,62,63 years, female 13.6

Contact

  • NEWS ARTICLES
  • PRESS ROOM

The Project

  • INTRODUCTION
  • ORGANIZATION
  • PUBLICATIONS

The Human Protein Atlas

  • DOWNLOADABLE DATA
  • LICENCE & CITATION
  • HELP & FAQ
KAW logo The Human Protein Atlas project is funded
by the Knut & Alice Wallenberg Foundation.

Facebook logo X logo Bluesky logo Linkedin logo RSS feed logo contact@proteinatlas.org
GCBR logo Elixir core logo SciLifeLab logo Uppsala university logo KI logo KTH logo