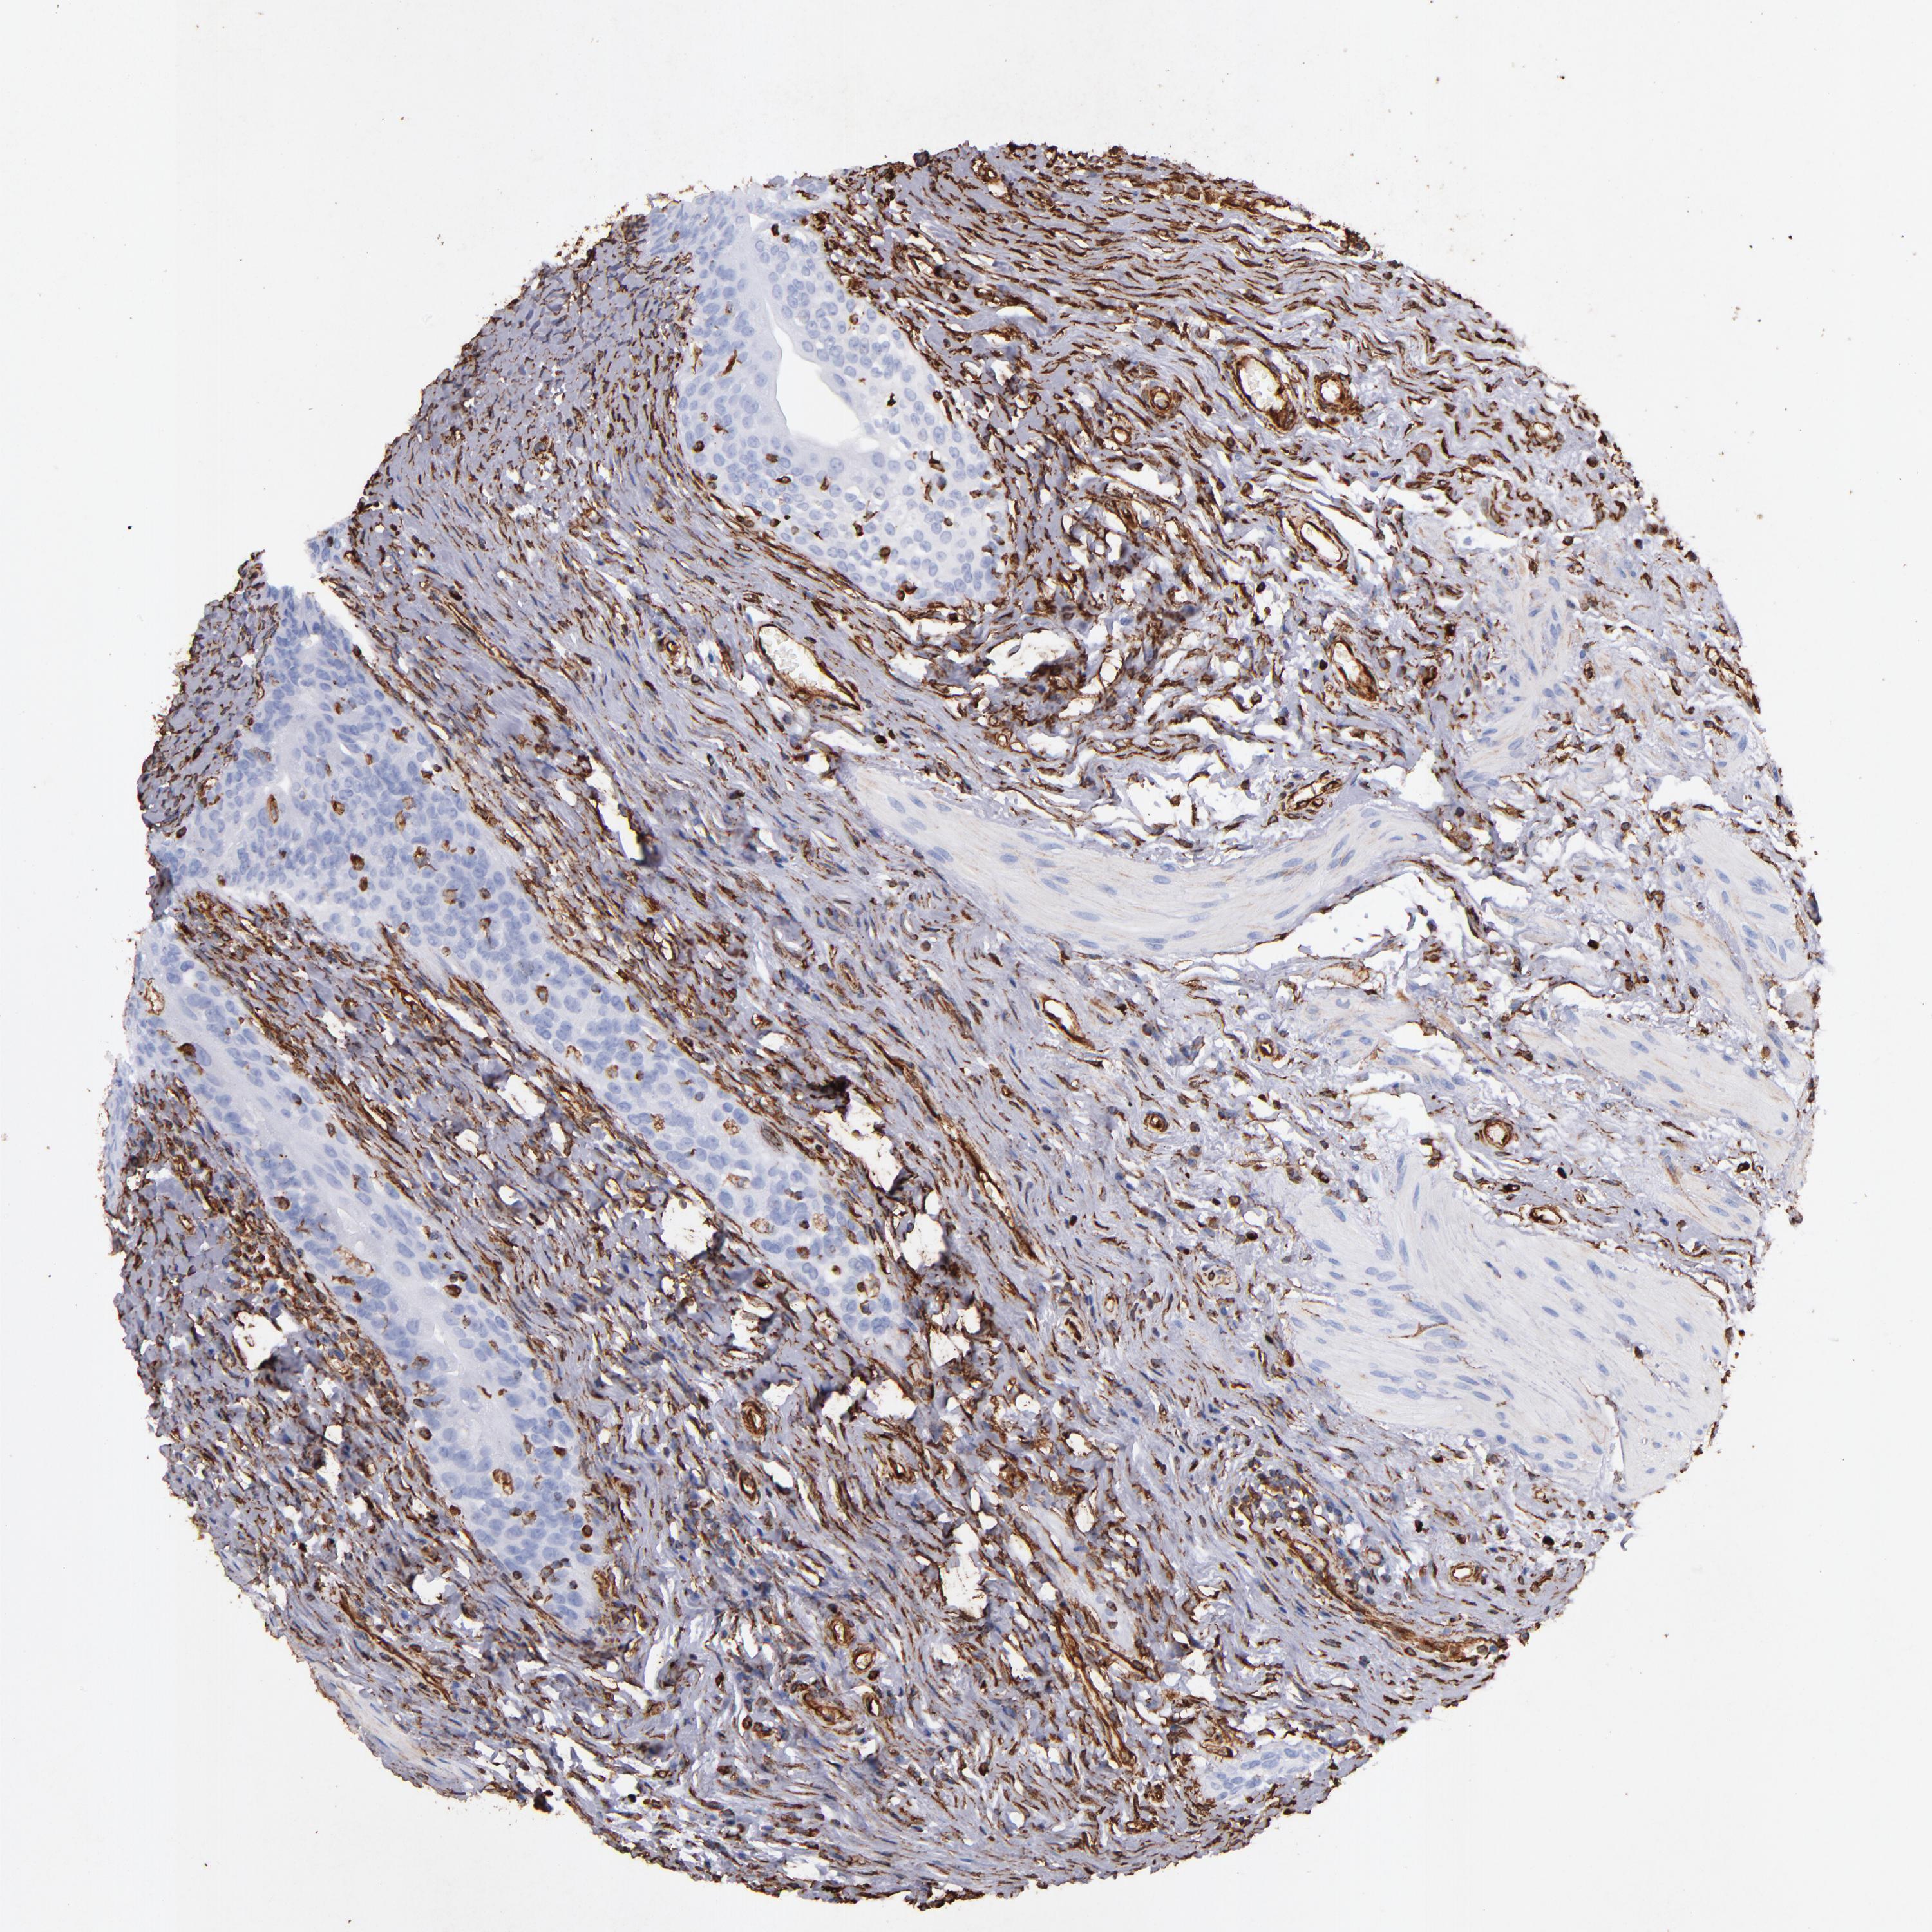
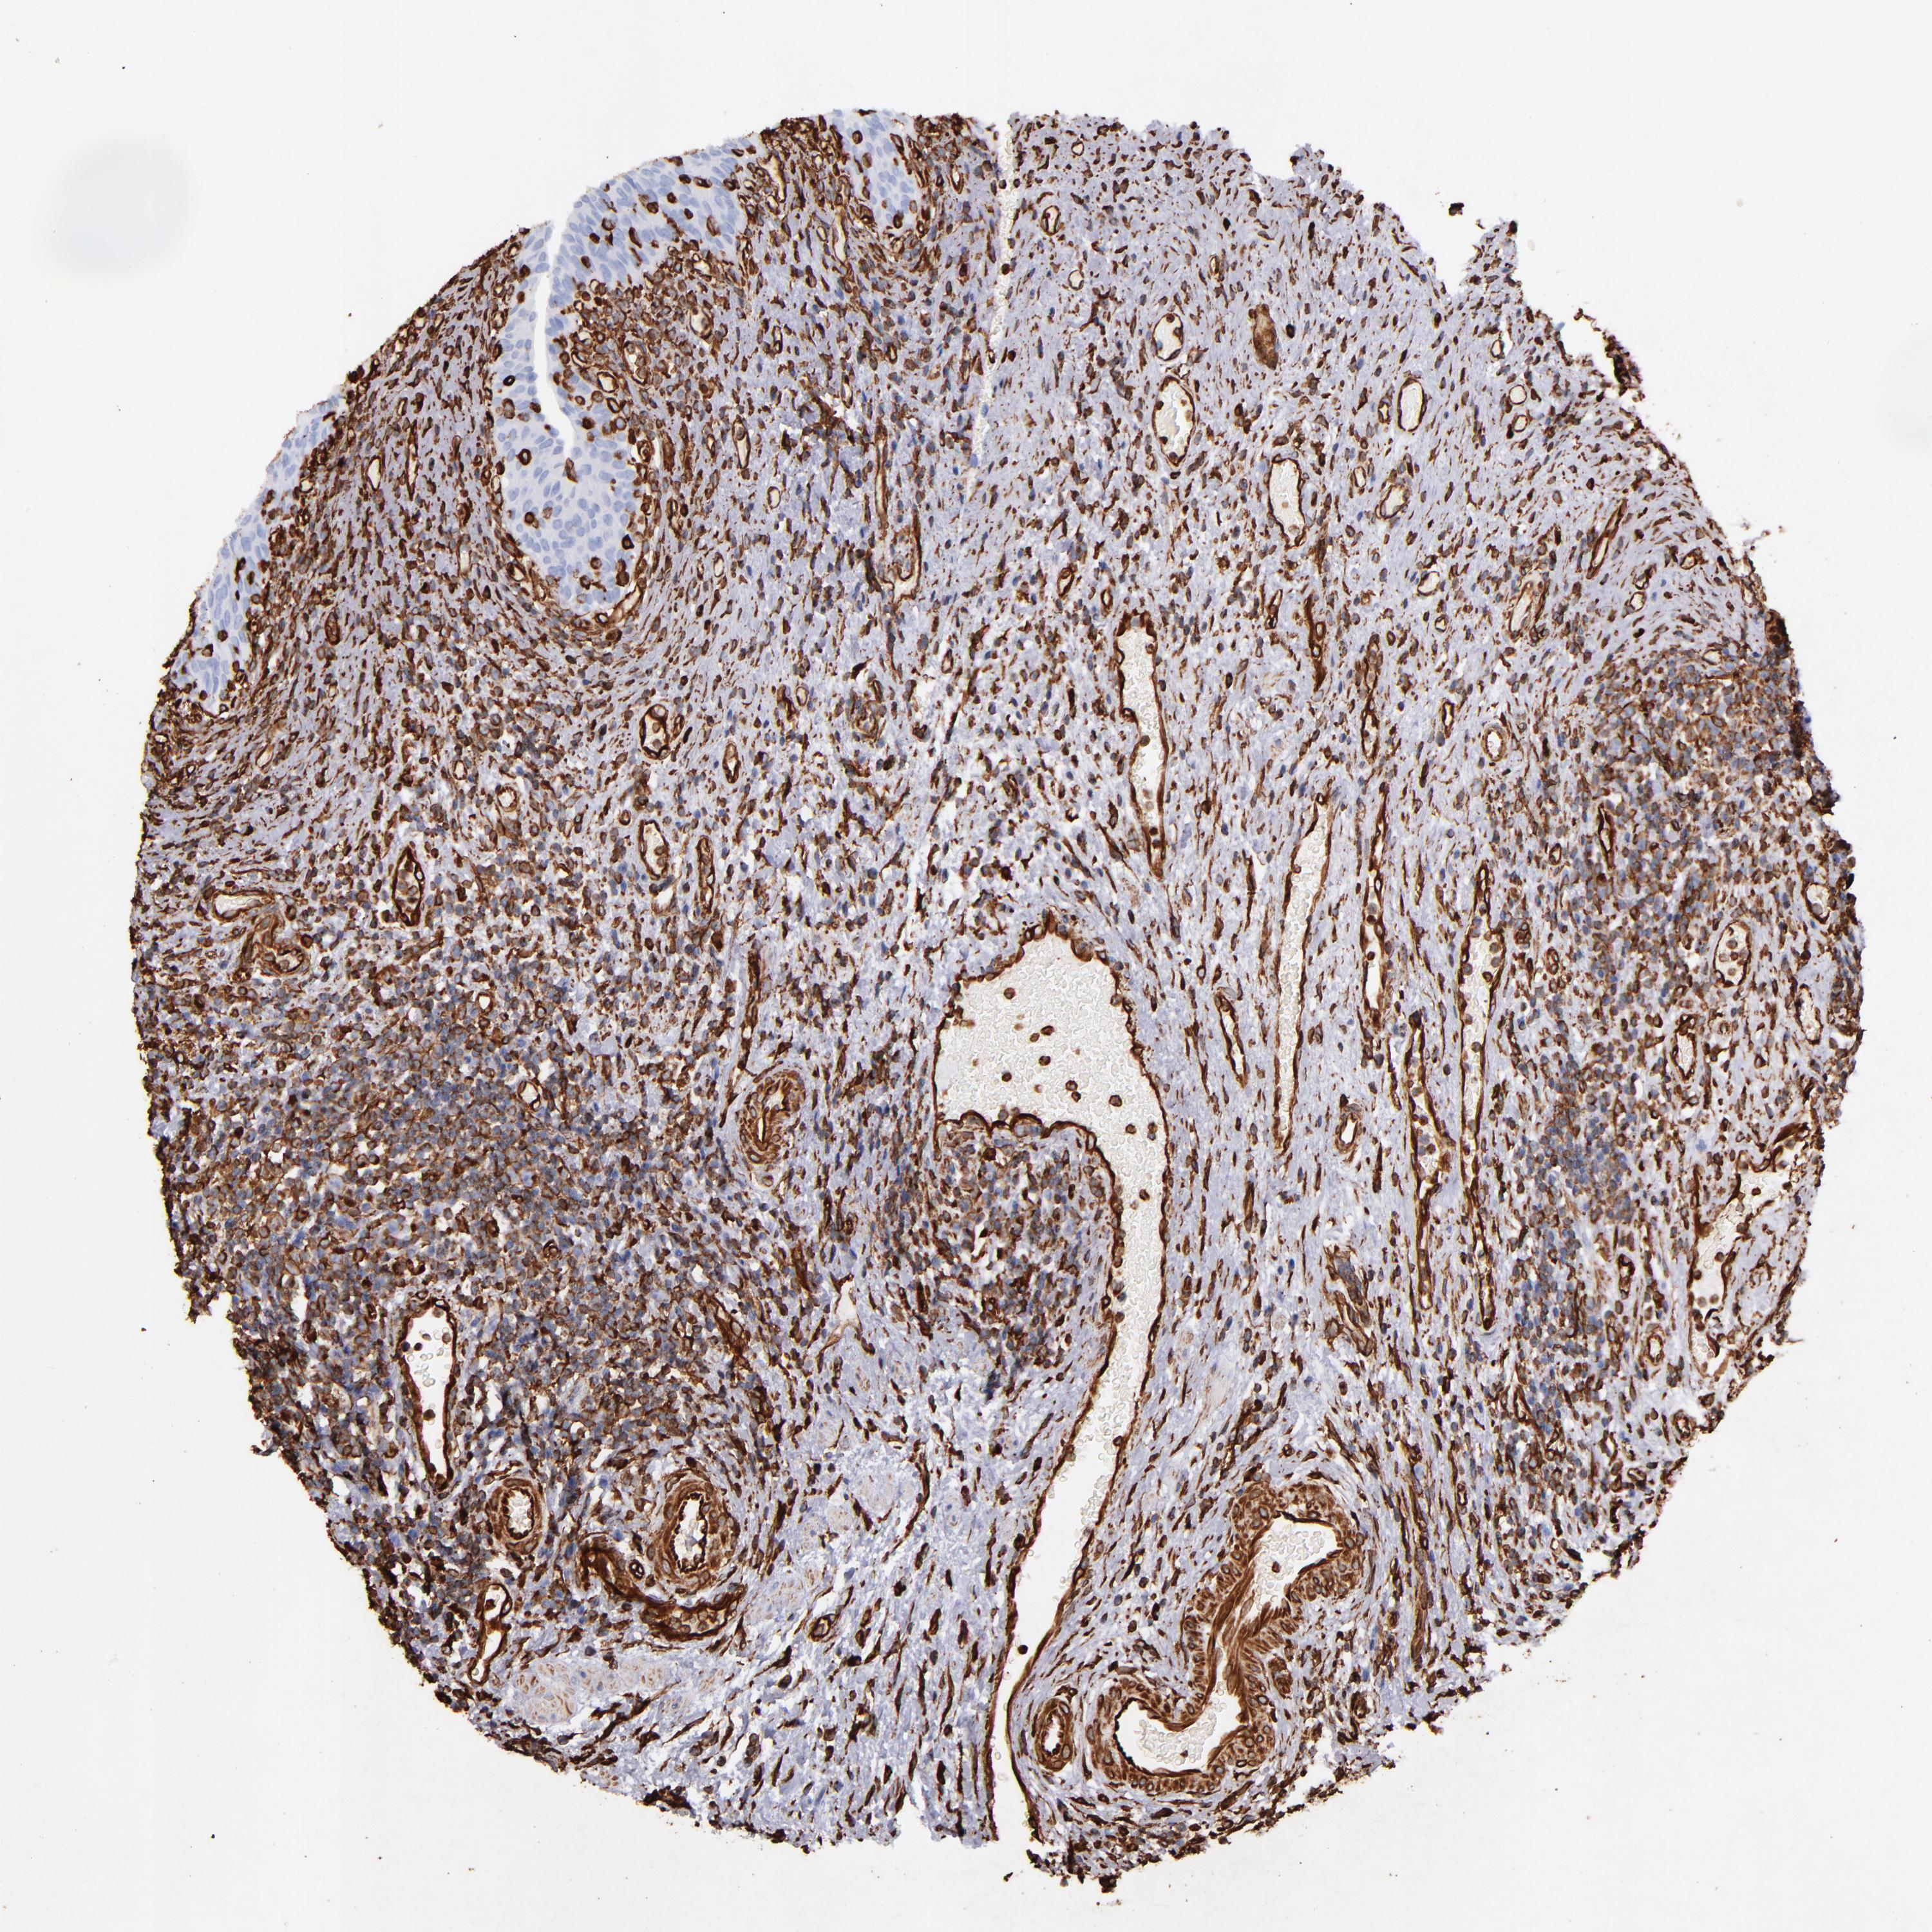
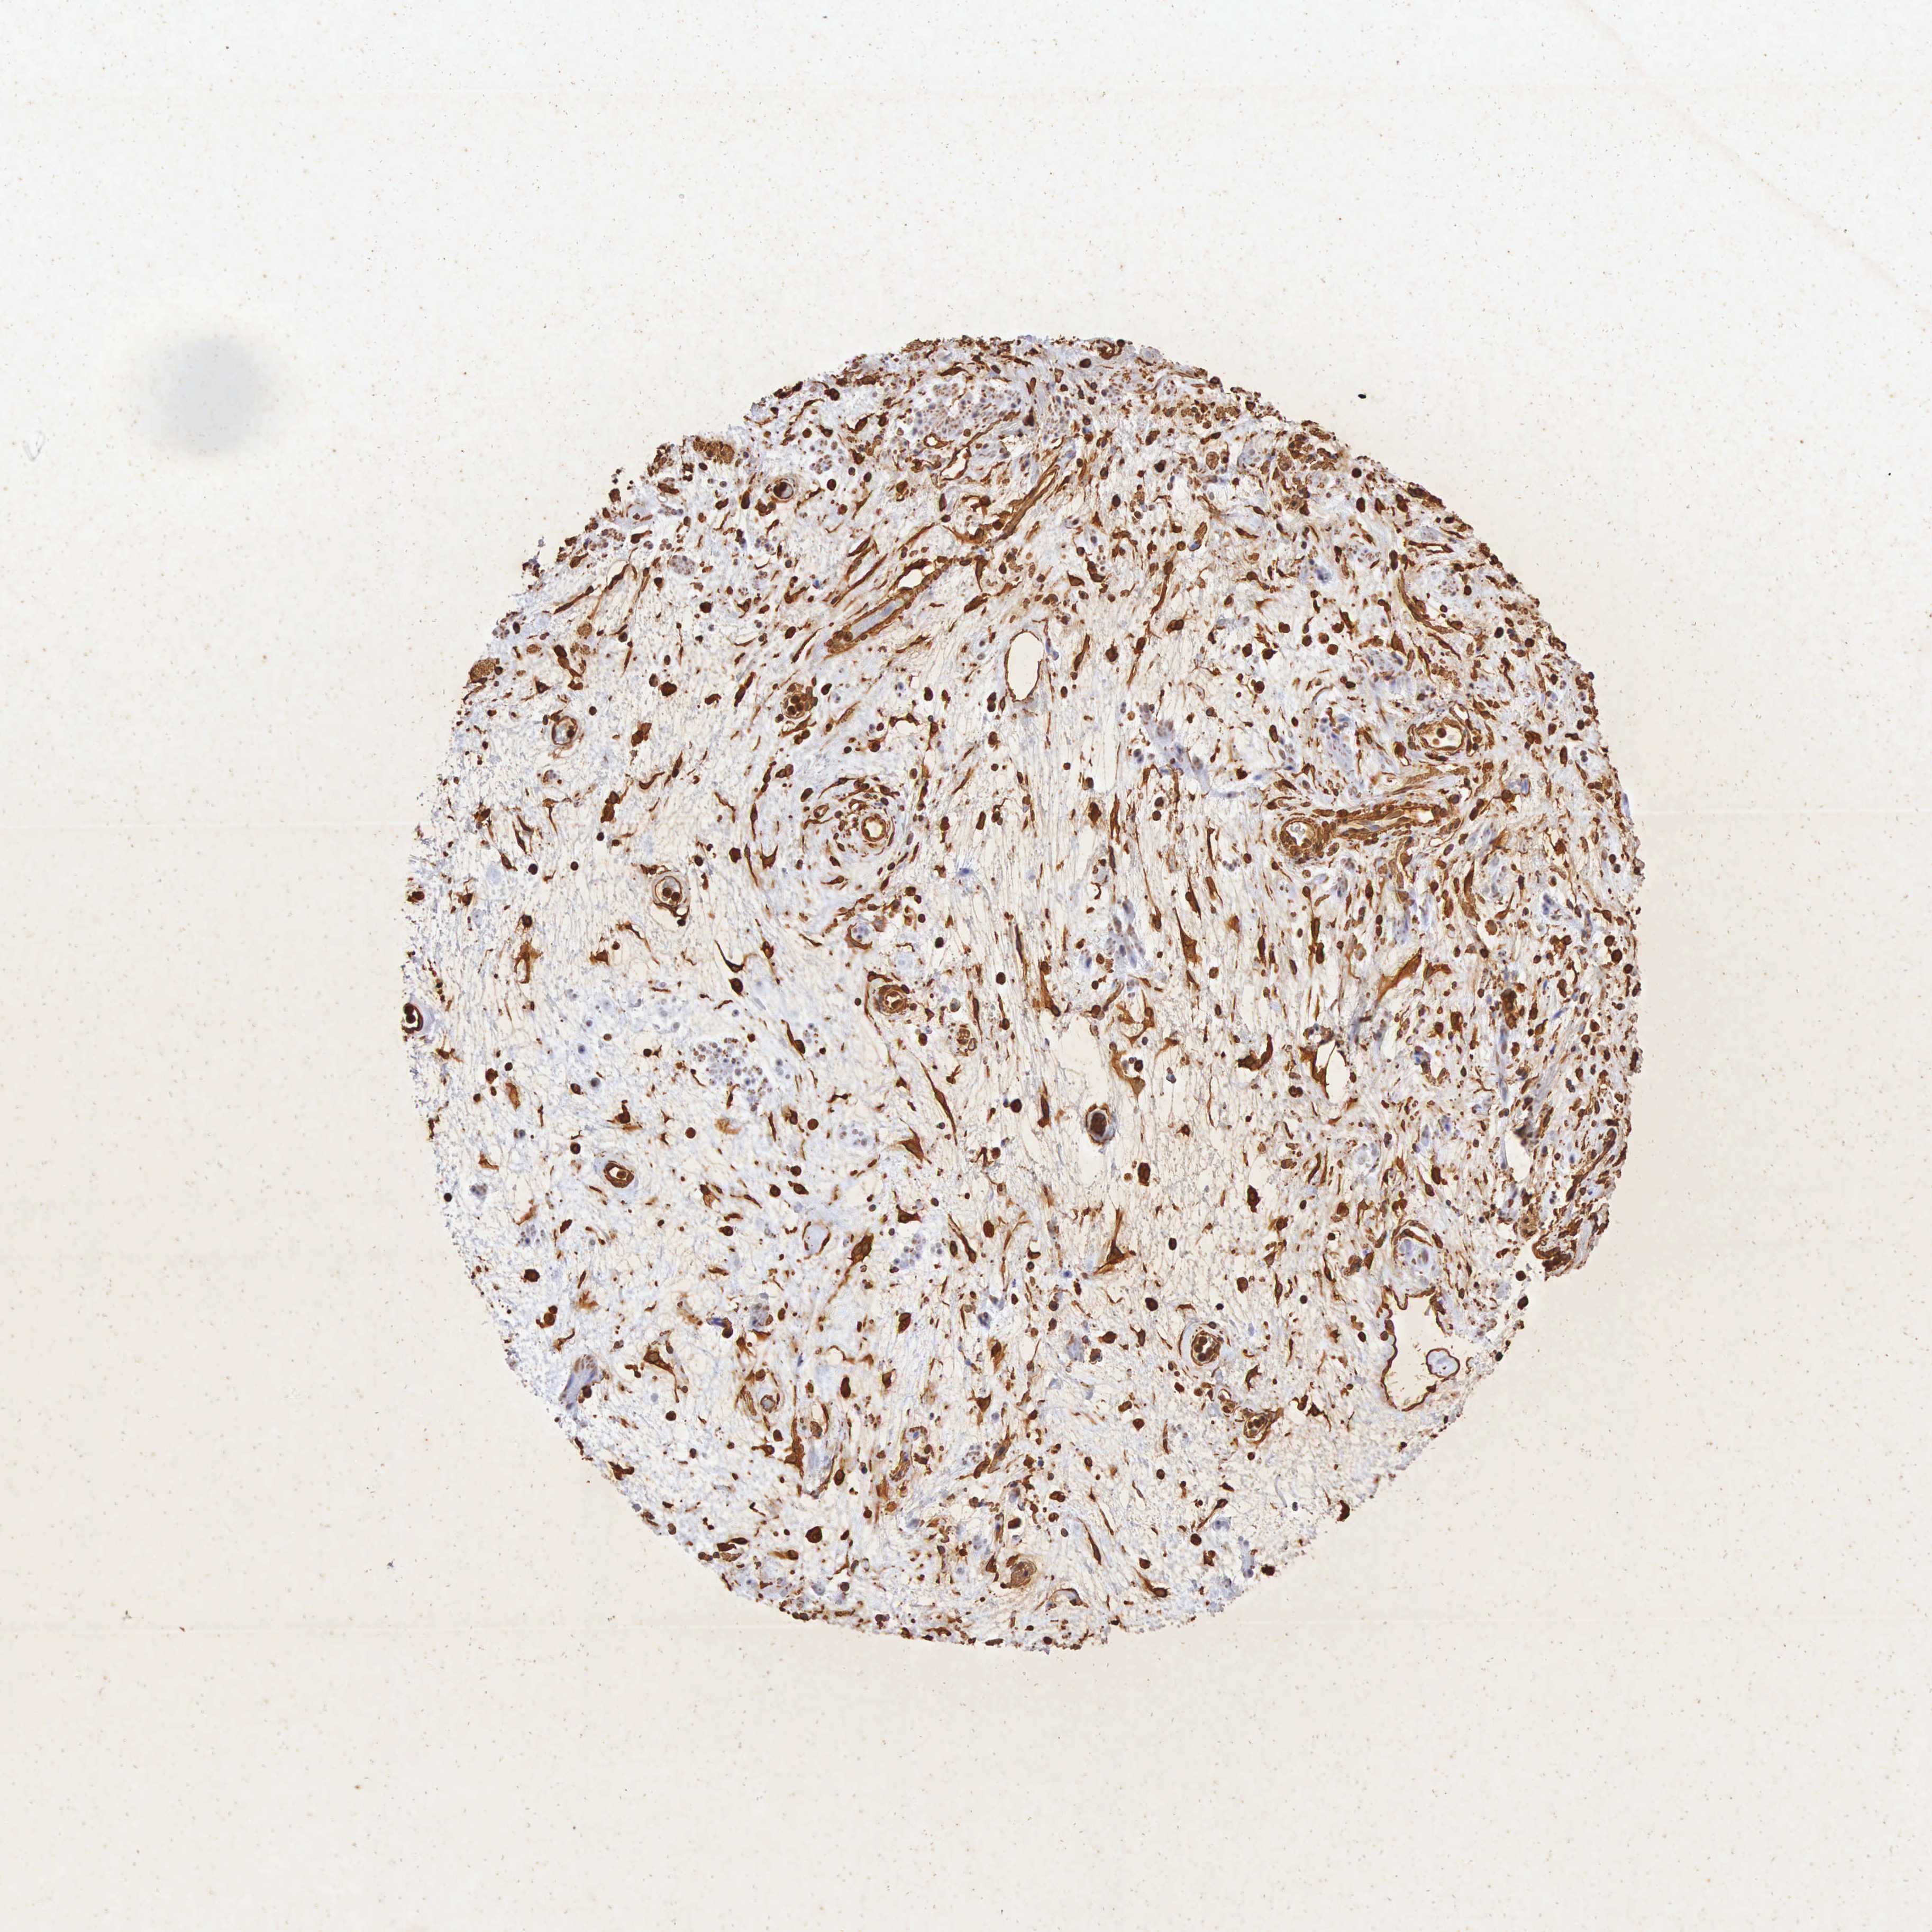
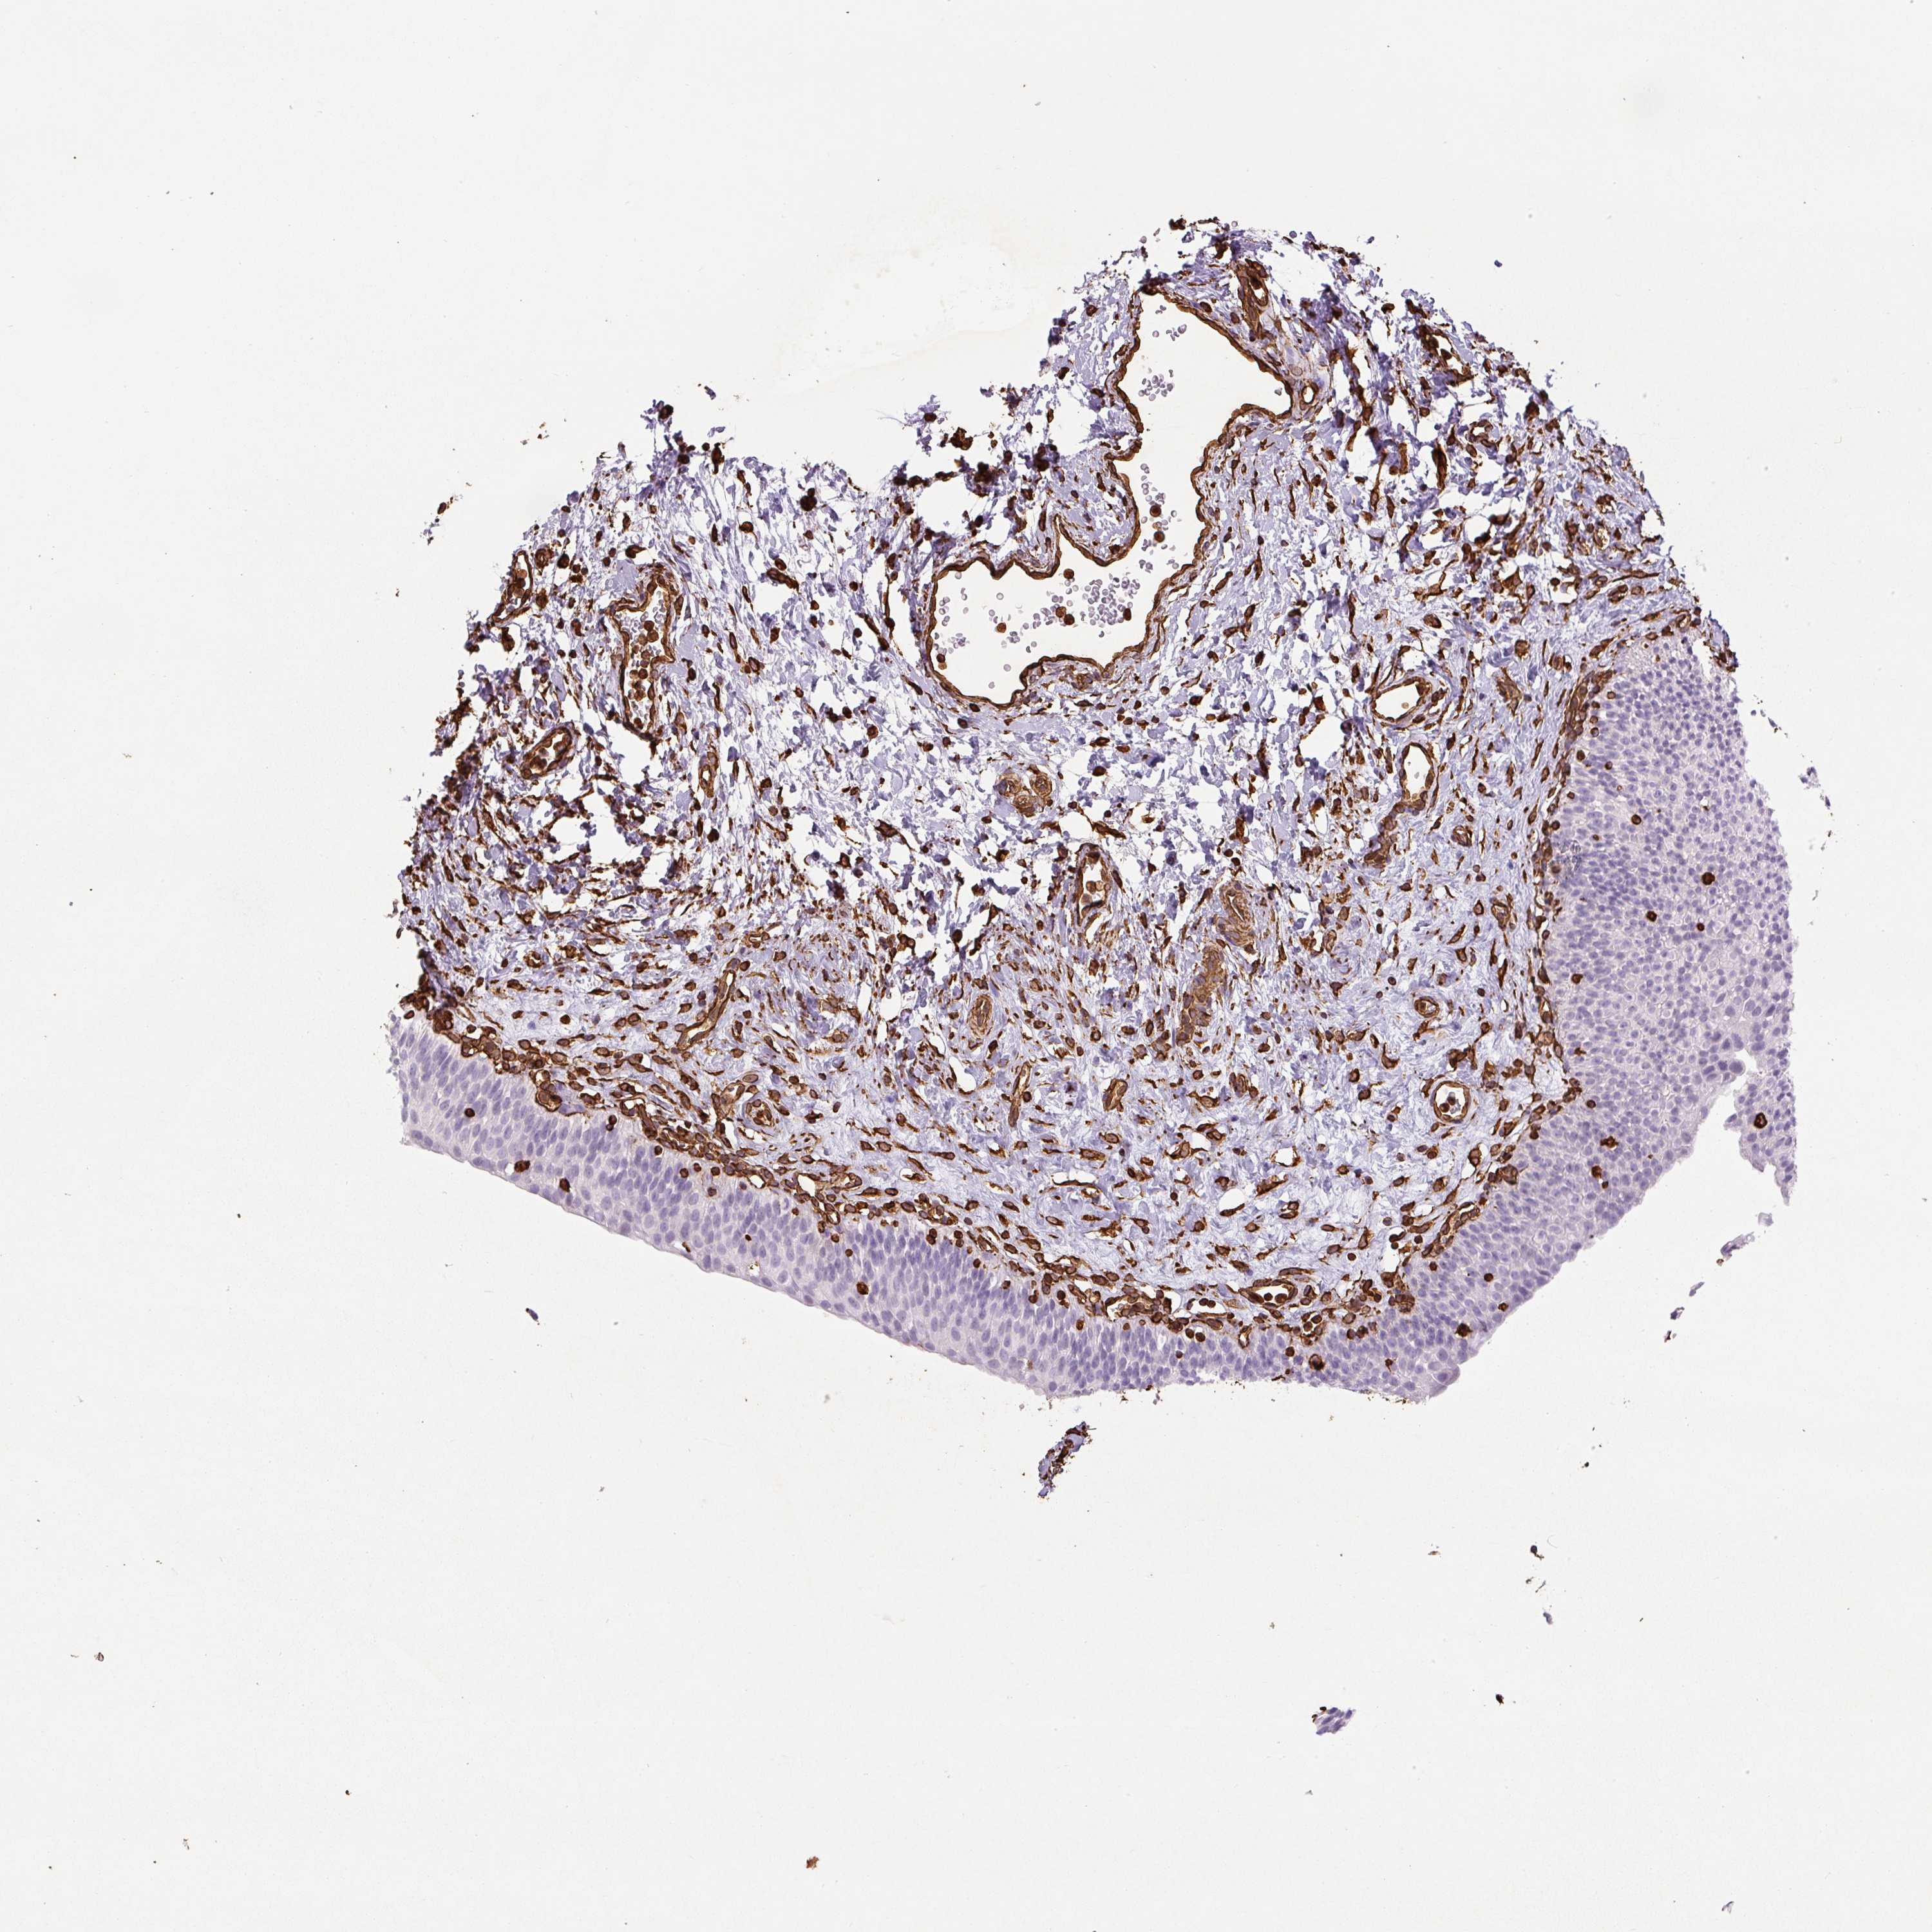
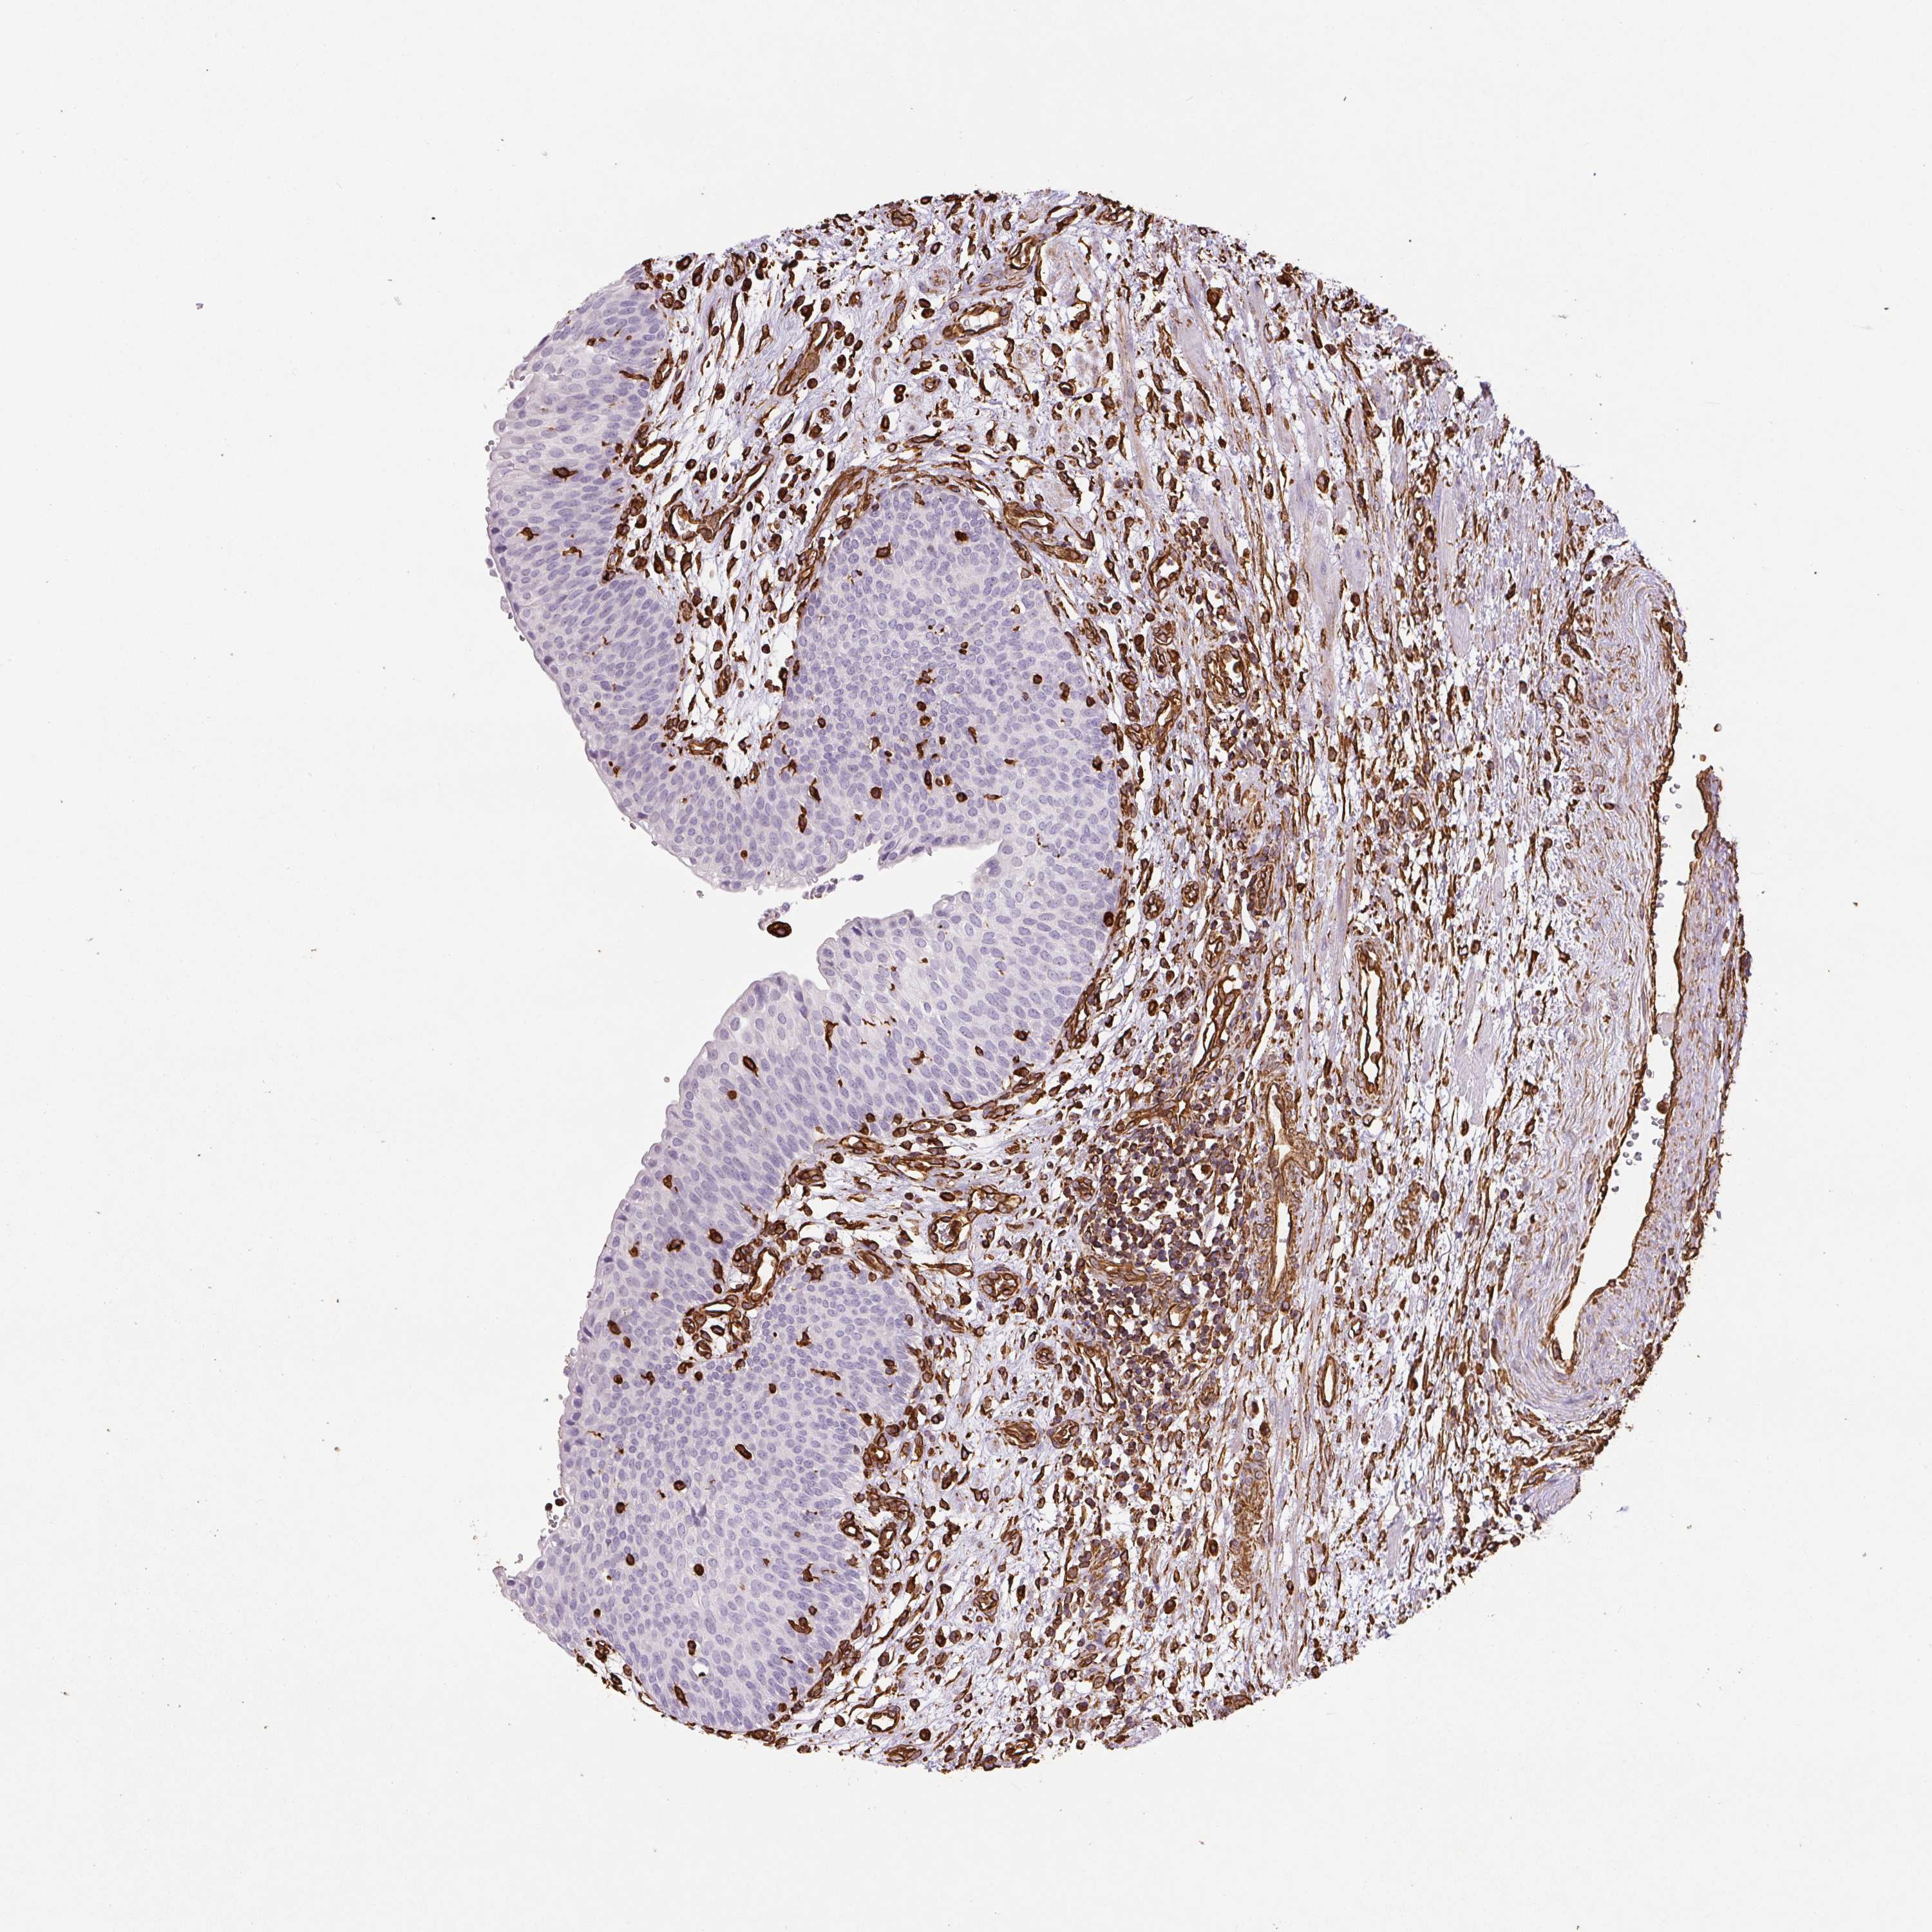
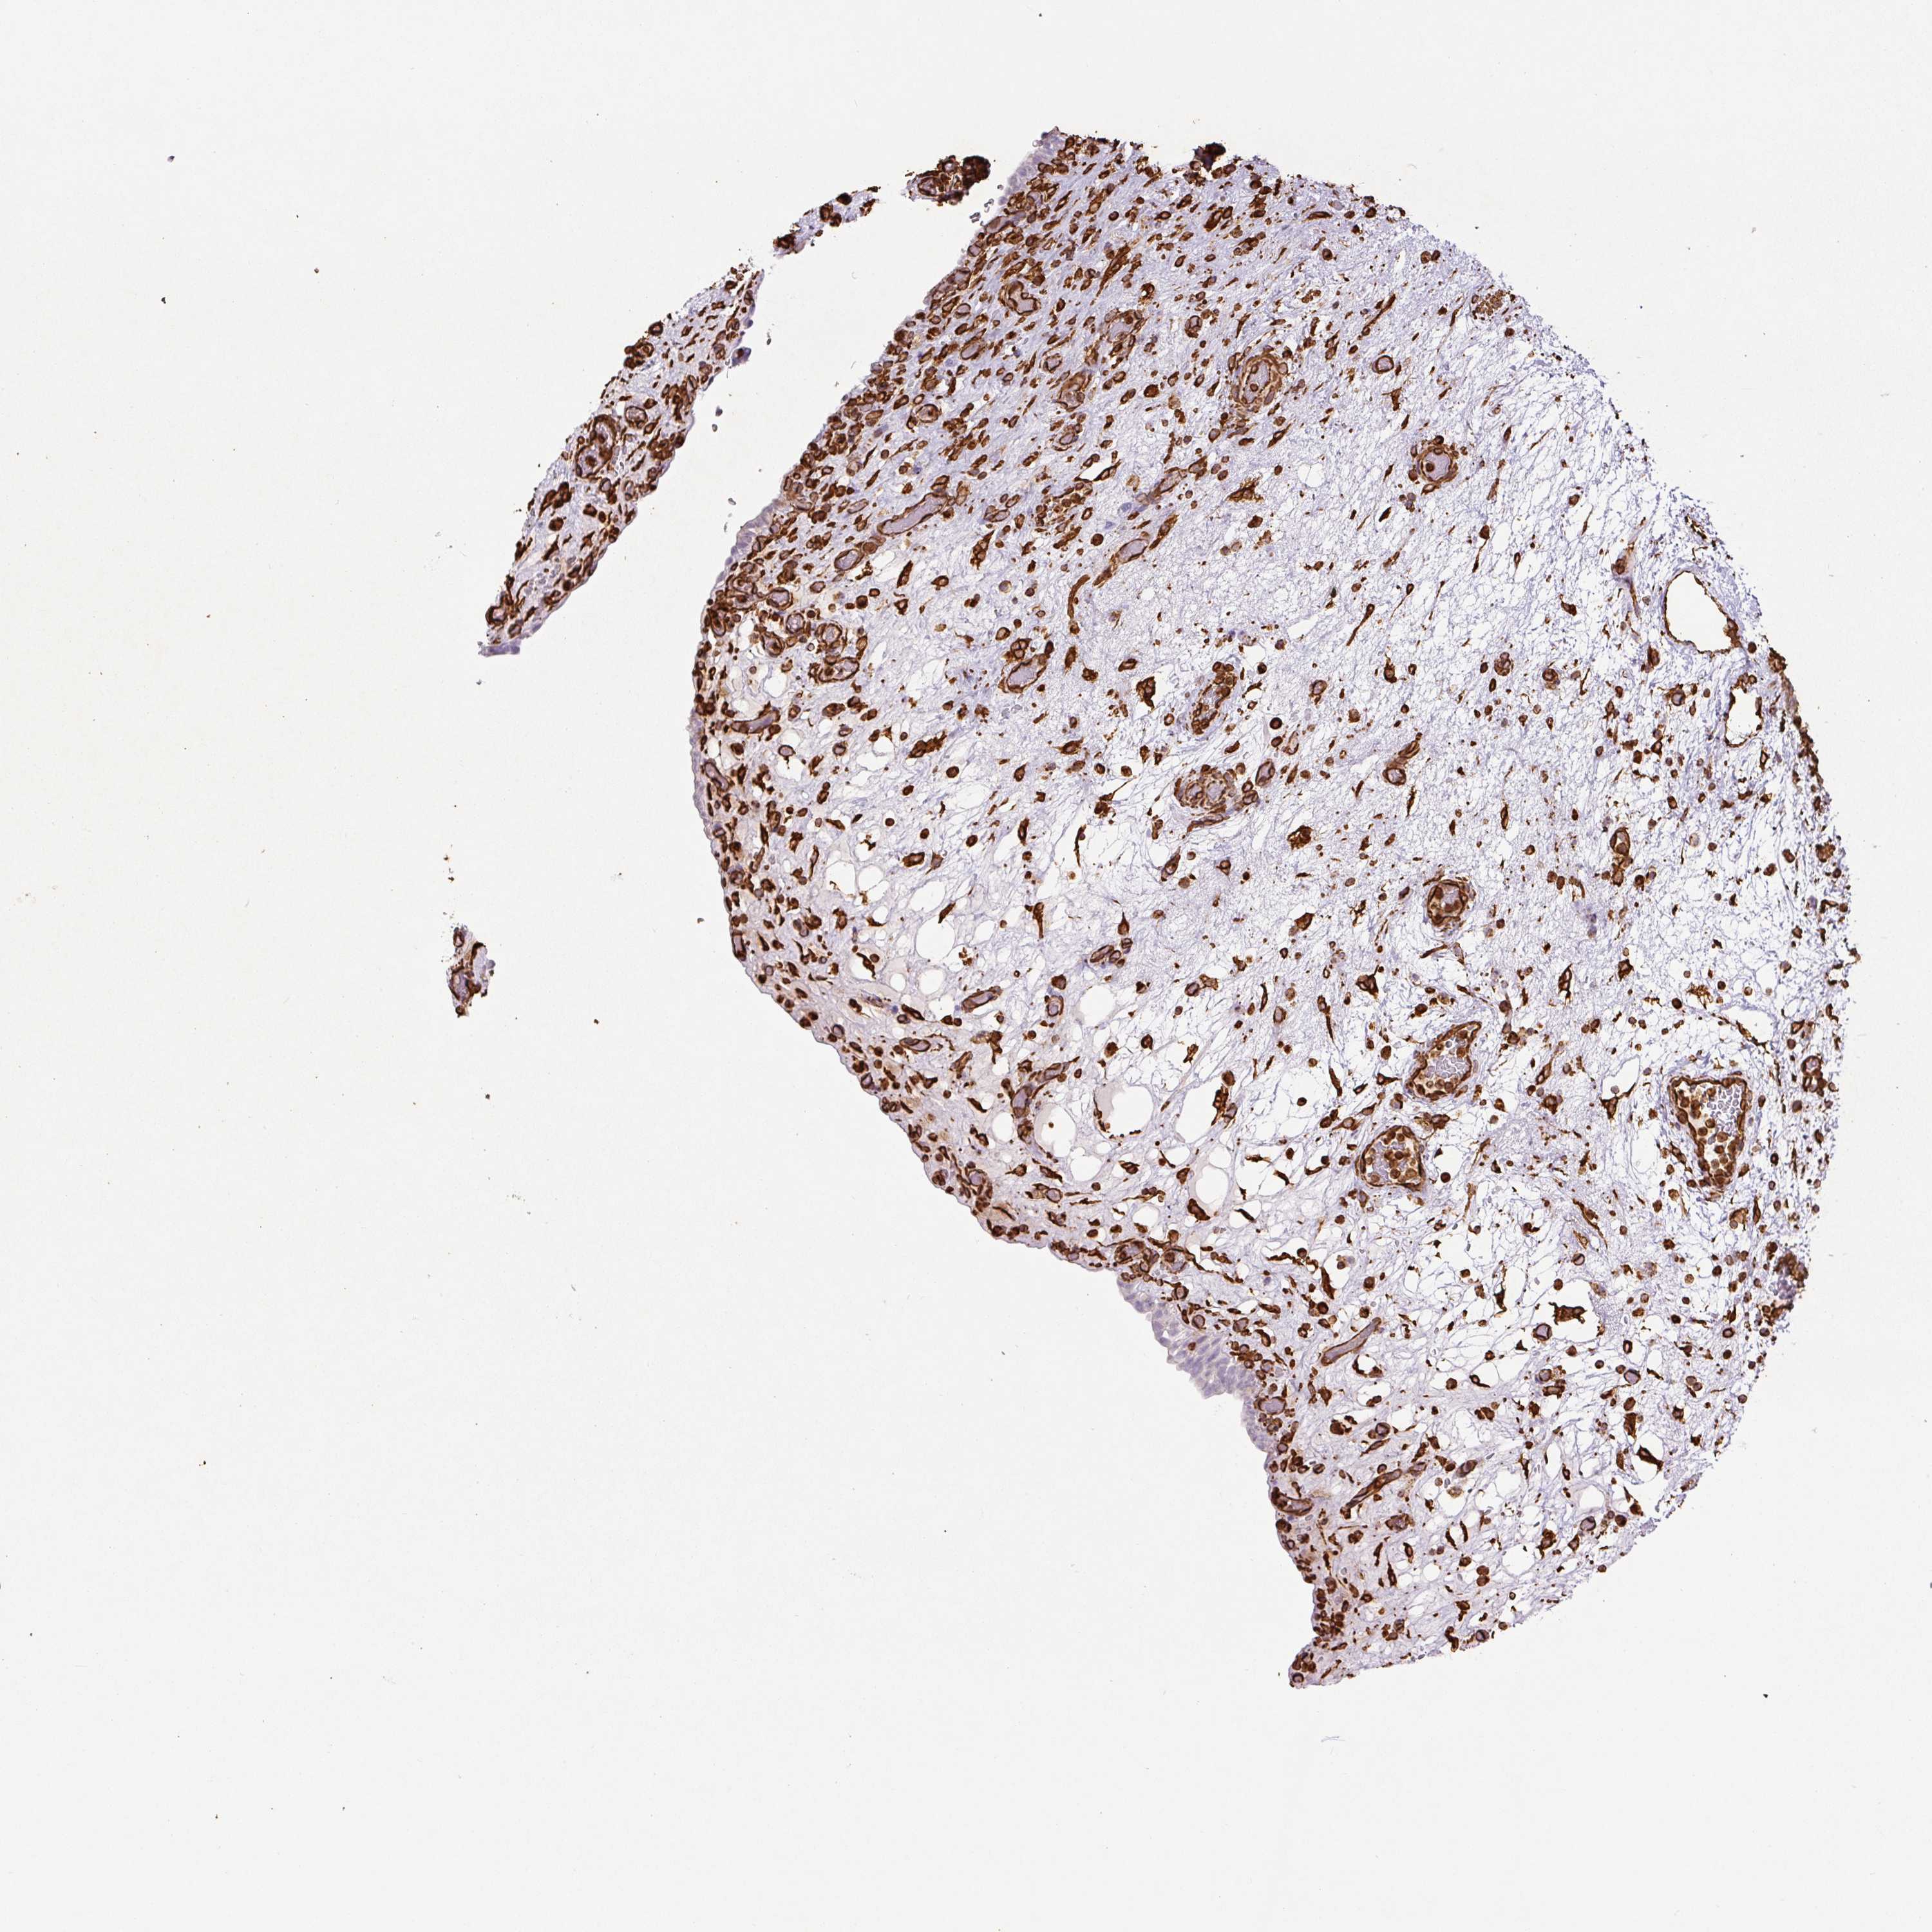
We use cookies to enhance the usability of our website. If you continue, we'll assume that you are happy to receive all cookies. More information. Don't show this again.
VIM
HPA
RESOURCES
  • TISSUE
  • BRAIN
  • SINGLE CELL
  • SUBCELLULAR
  • CANCER
  • BLOOD
  • CELL LINE
  • STRUCTURE
  • INTERACTION
ABOUT
  • INTRODUCTION
  • HISTORY
  • ORGANIZATION
  • PUBLICATIONS
  • ACKNOWLEDGMENTS
  • CONTACT
NEWS
  • NEWS ARTICLES
  • PRESS ROOM
LEARN
  • DICTIONARY
  • PROTEIN CLASSES
  • PROTEIN EVIDENCE
  • METHODS
  • EDUCATIONAL VIDEOS
DATA
  • DOWNLOADABLE DATA
  • PUBLICATION DATA
  • RELEASE HISTORY
HELP
  • HELP & FAQ
  • ANTIBODY AVAILABILITY
  • DISCLAIMER
  • PRIVACY STATEMENT
  • LICENCE & CITATION
Fields »
Search result

Field
Term
Gene name
Class
Subclass
Category
Keyword
Chromosome
External id
Tissue
Cell type
Expression
Antibody panel
Tissue
Main location
Patient ID
Annotation
Tissue
Category
Tau score
Cluster
Reliability
Brain region
Category
Tau score
Brain region
Category
Tau score
Brain region
Category
Tau score
Cluster
Reliability
Tissue
Cell type
Enrichment
Cell type
Category
Tau score
Cell type group
Category
Tau score
Cell type
Category
Tau score
Cell type
Category
Tau score
Cell lineage
Category
Tau score
Cluster
Cluster
Location
Searches
Location
Cell line
Class
Type
Phase
Reliability
Cancer
Prognosis
Cancer
Category
Cancer
Category
Tau score
Cluster
Variants
Interacting gene (ensg_id)
Type
Number of interactions
Pathway
ipTM
Category
Category
Category
Category
Validation
Validation
Validation
Validation
Antibodies
Data type
Column


  • SUMMARY

  • TISSUE

  • BRAIN

  • SINGLE CELL

  • SUBCELL

  • CANCER

  • BLOOD

  • CELL LINE

  • STRUCTURE

  • INTERACTION

  • VIM
TISSUE PRIMARY DATA URINARY BLADDER Show tissue menu
ADIPOSE TISSUE ADRENAL GLAND AMYGDALA APPENDIX BASAL GANGLIA BLOOD VESSEL BONE MARROW BREAST BRONCHUS CEREBELLUM CEREBRAL CORTEX CERVIX CHOROID PLEXUS COLON
DUODENUM ENDOMETRIUM EPIDIDYMIS ESOPHAGUS FALLOPIAN TUBE GALLBLADDER HEART MUSCLE HIPPOCAMPAL FORMATION HYPOTHALAMUS KIDNEY LIVER LUNG LYMPH NODE MIDBRAIN
NASOPHARYNX ORAL MUCOSA OVARY PANCREAS PARATHYROID GLAND PITUITARY GLAND PLACENTA PROSTATE RECTUM RETINA SALIVARY GLAND SEMINAL VESICLE SKELETAL MUSCLE SKIN
SMALL INTESTINE SMOOTH MUSCLE SOFT TISSUE SPINAL CORD SPLEEN STOMACH TESTIS THYMUS THYROID GLAND TONGUE TONSIL URINARY BLADDER VAGINA
ANTIBODIES
AND
VALIDATION
Dictionary
Urinary bladder
Tissue proteome
Tissue methods
URINARY BLADDER - Expression summary
Protein expression
Urinary bladderi

On the top, protein expression in current human tissue, based on all annotated cell types, is reported with the units not detected (n), low (l), medium (m) and high (h). Underneath, protein expression in each annotated cell type are reported using the same units. Protein expression data is based on knowledge-based annotation. For genes where more than one antibody has been used, a collective score is set. If knowledge-based annotation could not be performed for a gene, no data is displayed here. View antibody staining data further down this page.

h
m
l
n
Urothelial cells: Not detected
RNA expressioni

A summary of mRNA expression data available for current tissue based on several datasets. The mRNA expression levels in human tissues are based on RNA-seq data generated by the Human Protein Atlas HPA, Genotype-Tissue Expression GTEx portal and CAGE data generated by the FANTOM5 consortium. Consensus normalized expression levels for human tissues was created by combining the data from HPA and GTEx datasets. The mRNA expression levels in pig brain are based on RNA-seq data generated by the Human Protein Atlas, and for mouse brain HPA data and in situ hybridization generated by the Allen brain atlas dataset are reported.

Scroll down to view mRNA expression data in more detail.

Consensus:860.5 nTPM
HPA:806.3 nTPM
GTEx:860.5 nTPM
FANTOM5:1762.4 Scaled Tags Per Million
URINARY BLADDER - SINGLE CELL RNA EXPRESSION
Explore single cell type data

URINARY BLADDER - Antibody stainingi

Antibody staining in the annotated cell types in the current human tissue is reported as not detected, low, medium, or high, based on conventional immunohistochemistry profiling in selected tissues. This score is based on the combination of the staining intensity and fraction of stained cells. Each image is clickable and will lead to virtual microscopy that enables deeper exploration of all samples and also displays staining intensity scores, fraction scores and subcellular localization as well as patient and tissue information for each sample.

Ascending and descending describe two types of gradient, based on difference in staining intensity between enterocytes in crypts and apical enterocytes.

Ascending - the staining intensity is stronger in apical enterocytes (towards the lumen) compared to enterocytes in the crypts (gland based)

Descending - the staining is weaker in apical enterocytes compared to enterocytes in crypts

Antibody HPA001762Antibody CAB000080Antibody CAB058687
Urothelial cells MediumNot detectedNot detected


URINARY BLADDER - HPA RNA-seqi

The RNA-seq details section shows detailed information about the individual samples used for the transcript profiling and results of the RNA-seq analysis.

Information about each individual sample is listed below, including gender, age, a tissue section image and estimated fractions of cell types. nTPM (normalized transcripts per million) values give a quantification of the gene abundance which is comparable between different genes and samples.

Average nTPMi

Max subtype nTPM is the value for the subtype with the largest average nTPM across the subtype samples.

806.3
overview
Male, age 74
Urinary bladder sample 264
nTPM: 867.7
Cell types%
Urothelial cells:
5

Smooth muscle cells:
60

Fibroblasts:
20

Endothelial cells:
10

Other cell types:
5

overview
Male, age 80
Urinary bladder sample 265
nTPM: 354.2
Cell types%
Urothelial cells:
10

Smooth muscle cells:
45

Fibroblasts:
15

Endothelial cells:
10

Other cell types:
20

N/A
Female, age 0.1
Urinary bladder sample 1597
nTPM: 1176.5
N/A
Female, age 0.1
Urinary bladder sample 1598
nTPM: 826.7

URINARY BLADDER - GTEx RNA-seqi

RNA-Seq data generated by the Genotype-Tissue Expression (GTEx) project from human tissues is reported as mean nTPM. More information can be found on the GTEx portal.

Distribution across the dataset is visualized with box plots, shown as median and 25th and 75th percentiles. Points are displayed as outliers if they are above or below 1.5 times the interquartile range. nTPM values of the individual samples are presented next to the box plot.

Max subtype nTPMi

Max subtype nTPM is the value for the subtype with the largest average nTPM across the subtype samples.

860.5
GTEx sample id Sample description nTPM
Bladder
Average nTPM: 860.5
Samples: 77

Max nTPM: 2032.1
Min nTPM: 319.4
Std nTPM: 387.6
Median nTPM: 769.2
GTEX-OXRK-1926-SM-GRR1N 50-59 years, female 2032.1
GTEX-P44H-2226-SM-E9U4P 40-49 years, male 2000.7
GTEX-T8EM-1726-SM-GPRWO 40-49 years, male 1987.0
GTEX-QLQ7-1226-SM-GOQYE 60-69 years, male 1688.3
GTEX-RNOR-2126-SM-EXURR 50-59 years, female 1628.3
GTEX-R45C-2426-SM-HL11G 60-69 years, female 1520.9
GTEX-QDT8-2826-SM-GOQYY 30-39 years, female 1470.6
GTEX-T5JC-1126-SM-GPIA1 20-29 years, male 1454.7
GTEX-NPJ8-1126-SM-GNTAI 40-49 years, male 1405.9
GTEX-T6MN-2226-SM-EVYAM 50-59 years, male 1323.1
GTEX-U3ZH-0826-SM-H6Q7I 30-39 years, male 1268.1
GTEX-N7MT-1826-SM-GQ1C9 60-69 years, female 1230.5
GTEX-S95S-0626-SM-EZ6L8 60-69 years, male 1220.9
GTEX-S33H-1926-SM-EYYVH 30-39 years, male 1179.6
GTEX-S4P3-0826-SM-H7OF3 50-59 years, female 1145.6
GTEX-QEG4-2126-SM-GQ1CE 30-39 years, male 1122.2
GTEX-QDVN-1426-SM-GPRWL 50-59 years, male 1100.9
GTEX-TMMY-1526-SM-4DXST 40-49 years, female 1061.2
GTEX-R55C-1226-SM-GOQY7 40-49 years, male 1059.9
GTEX-Q734-1226-SM-GRR21 40-49 years, female 1023.4
GTEX-P4PQ-1926-SM-GRR14 60-69 years, male 997.9
GTEX-RWSA-2126-SM-H7OG7 40-49 years, male 997.1
GTEX-RN64-2426-SM-EZ6L2 50-59 years, male 980.9
GTEX-REY6-2026-SM-GPRYL 60-69 years, male 959.6
GTEX-QV31-0926-SM-GQ1C6 30-39 years, male 949.5
GTEX-U3ZM-0826-SM-4DXU6 40-49 years, male 928.2
GTEX-OIZI-1926-SM-H7OGY 40-49 years, male 914.0
GTEX-P4QS-1926-SM-GQ1BY 60-69 years, male 906.2
GTEX-RWS6-1426-SM-GPRWQ 60-69 years, female 900.5
GTEX-T2IS-2526-SM-GRR23 20-29 years, female 878.0
GTEX-QCQG-0826-SM-GPI8H 50-59 years, female 831.9
GTEX-OIZF-1926-SM-7PBZS 60-69 years, male 825.0
GTEX-S4UY-0926-SM-4AD6O 40-49 years, female 815.4
GTEX-S7SF-1126-SM-GQ1CH 20-29 years, female 799.2
GTEX-S32W-1126-SM-4AD5V 50-59 years, female 794.9
GTEX-QMRM-1326-SM-HAUYS 50-59 years, male 793.4
GTEX-QLQW-0826-SM-H7OG2 30-39 years, male 790.7
GTEX-PLZ5-1326-SM-GQ1C2 50-59 years, male 771.9
GTEX-OIZH-1926-SM-GPRXO 50-59 years, male 769.2
GTEX-QEL4-1826-SM-EZ6KU 50-59 years, male 758.8
GTEX-QXCU-2226-SM-GPI87 50-59 years, male 754.4
GTEX-N7MS-2126-SM-GRR2X 60-69 years, male 753.6
GTEX-P4QT-1926-SM-HAUYQ 50-59 years, female 726.1
GTEX-OOBJ-1926-SM-GRR1P 60-69 years, male 715.1
GTEX-O5YT-1926-SM-H6Q82 20-29 years, male 702.7
GTEX-P4PP-1926-SM-HAUZM 30-39 years, female 694.4
GTEX-Q2AI-1026-SM-GRR3I 40-49 years, male 685.9
GTEX-POMQ-0926-SM-H6Q6H 20-29 years, female 668.7
GTEX-Q2AH-1326-SM-GPRWF 40-49 years, male 659.1
GTEX-OHPK-1926-SM-H7OF2 50-59 years, female 655.4
GTEX-P78B-2126-SM-GQ1C3 40-49 years, female 654.2
GTEX-PW2O-1026-SM-GPRWA 20-29 years, male 650.6
GTEX-R55G-1326-SM-HAUYU 40-49 years, female 644.7
GTEX-T5JW-1026-SM-EZ6LR 20-29 years, female 638.0
GTEX-QEG5-2326-SM-GRR2Z 20-29 years, male 630.3
GTEX-RM2N-1026-SM-GOQY8 50-59 years, male 617.2
GTEX-PX3G-1926-SM-GQ1ED 20-29 years, female 606.8
GTEX-SNMC-0826-SM-4DM66 20-29 years, male 589.5
GTEX-U4B1-1226-SM-4DXT7 40-49 years, male 569.8
GTEX-T6MO-0926-SM-GPRWN 40-49 years, female 560.7
GTEX-S4Q7-0926-SM-4AD5D 20-29 years, male 554.0
GTEX-TKQ2-0526-SM-GRR15 50-59 years, male 549.6
GTEX-PWN1-1926-SM-HAUZN 40-49 years, female 549.0
GTEX-PWCY-1126-SM-H7OGX 20-29 years, female 521.9
GTEX-U3ZN-1226-SM-4DXUD 30-39 years, female 517.0
GTEX-OHPM-1926-SM-H7OG1 50-59 years, male 492.0
GTEX-SE5C-1026-SM-4BRUG 40-49 years, female 486.9
GTEX-SUCS-1226-SM-GPI9A 70-79 years, male 478.6
GTEX-S3XE-1226-SM-4AD4L 50-59 years, male 475.0
GTEX-RUSQ-1326-SM-GQ1EA 50-59 years, male 449.7
GTEX-QV44-1426-SM-GPI8D 50-59 years, male 449.6
GTEX-PLZ6-1026-SM-GQ1C8 30-39 years, male 443.1
GTEX-R53T-1426-SM-H7OG3 50-59 years, female 410.0
GTEX-OOBK-1926-SM-HAUZL 40-49 years, male 381.3
GTEX-QDVJ-1526-SM-GPI84 50-59 years, male 365.6
GTEX-OHPL-1926-SM-HAV18 60-69 years, female 351.7
GTEX-SNOS-0526-SM-4DM54 40-49 years, male 319.4
Show allShow less

URINARY BLADDER - FANTOM5 CAGEi

RNA expression in human tissues obtained through Cap Analysis of Gene Expression (CAGE) generated by the FANTOM5 project are reported as Scaled Tags Per Million.

Max subtype Scaled Tags Per Millioni

Max subtype Scaled Tags Per Million is the value for the subtype with the largest average Scaled Tags Per Million across the subtype samples.

1762.4
FANTOM5 sample id Sample description Scaled Tags Per Million
Bladder
Scaled Tags Per Million: 1762.4
FF:10011-101C2 55,58,79 years, mixed 1762.4

Contact

  • NEWS ARTICLES
  • PRESS ROOM

The Project

  • INTRODUCTION
  • ORGANIZATION
  • PUBLICATIONS

The Human Protein Atlas

  • DOWNLOADABLE DATA
  • LICENCE & CITATION
  • HELP & FAQ
KAW logo The Human Protein Atlas project is funded
by the Knut & Alice Wallenberg Foundation.

Facebook logo X logo Bluesky logo Linkedin logo RSS feed logo contact@proteinatlas.org
GCBR logo Elixir core logo SciLifeLab logo Uppsala university logo KI logo KTH logo