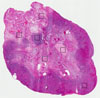
On the top, protein expression in current human tissue, based on all annotated cell types, is reported with the units not detected (n), low (l), medium (m) and high (h). Underneath, protein expression in each annotated cell type are reported using the same units. Protein expression data is based on knowledge-based annotation. For genes where more than one antibody has been used, a collective score is set. If knowledge-based annotation could not be performed for a gene, no data is displayed here. View antibody staining data further down this page.
h
m
l
n
Ovarian stroma cells:
Not detected
RNA expressioni
A summary of mRNA expression data available for current tissue based on several datasets. The mRNA expression levels in human tissues are based on RNA-seq data generated by the Human Protein Atlas HPA, Genotype-Tissue Expression GTEx portal and CAGE data generated by the FANTOM5 consortium. Consensus normalized expression levels for human tissues was created by combining the data from HPA and GTEx datasets. The mRNA expression levels in pig brain are based on RNA-seq data generated by the Human Protein Atlas, and for mouse brain HPA data and in situ hybridization generated by the Allen brain atlas dataset are reported.
Scroll down to view mRNA expression data in more detail.
Antibody staining in the annotated cell types in the current human tissue is reported as not detected, low, medium, or high, based on conventional immunohistochemistry profiling in selected tissues. This score is based on the combination of the staining intensity and fraction of stained cells. Each image is clickable and will lead to virtual microscopy that enables deeper exploration of all samples and also displays staining intensity scores, fraction scores and subcellular localization as well as patient and tissue information for each sample.
Ascending and descending describe two types of gradient, based on difference in staining intensity between enterocytes in crypts and apical enterocytes.
Ascending - the staining intensity is stronger in apical enterocytes (towards the lumen) compared to enterocytes in the crypts (gland based)
Descending - the staining is weaker in apical enterocytes compared to enterocytes in crypts
Antibody HPA008848
Antibody CAB002147
Ovarian stroma cells
Low
Not detected
OVARY - PROTEINTALKS DB MS
Median intensity
21420
Sample
Intensity
Ovary_01
15874
Ovary_02
26966
OVARY - MANN MS
Median intensity
104887799
Replicate
Intensity
Ovary_01
98719592
Ovary_02
104887799
Ovary_03
115612149
OVARY - HPA RNA-seqi
The RNA-seq details section shows detailed information about the individual samples used for the transcript profiling and results of the RNA-seq analysis.
Information about each individual sample is listed below, including gender, age, a tissue section image and estimated fractions of cell types. nTPM (normalized transcripts per million) values give a quantification of the gene abundance which is comparable between different genes and samples.
Average nTPMi
Max subtype nTPM is the value for the subtype with the largest average nTPM across the subtype samples.
36.6
Female, age 64
Ovary sample 192 nTPM: 33.9
Cell types%
Stromal cells:
70
Smooth muscle cells:
15
Other cell types:
15
Female, age 52
Ovary sample 193 nTPM: 14.8
Cell types%
Stromal cells:
95
Other cell types:
5
Female, age 80
Ovary sample 308 nTPM: 15
Cell types%
Stromal cells:
70
Smooth muscle cells:
25
Other cell types:
5
Female, age 7
Ovary sample 3662 nTPM: 42
Female, age 16
Ovary sample 3663 nTPM: 61.6
Female, age 20
Ovary sample 3664 nTPM: 43.7
Female, age 32
Ovary sample 3665 nTPM: 45.1
OVARY - GTEx RNA-seqi
RNA-Seq data generated by the Genotype-Tissue Expression (GTEx) project from human tissues is reported as mean nTPM. More information can be found on the GTEx portal.
Distribution across the dataset is visualized with box plots, shown as median and 25th and 75th percentiles. Points are displayed as outliers if they are above or below 1.5 times the interquartile range. nTPM values of the individual samples are presented next to the box plot.
Max subtype nTPMi
Max subtype nTPM is the value for the subtype with the largest average nTPM across the subtype samples.
49.8
GTEx sample id
Sample description
nTPM
Ovary Average nTPM: 49.8
Samples: 193
Max nTPM: 693.3
Min nTPM: 1.9
Std nTPM: 75.4
Median nTPM: 24.4
GTEX-R55G-1526-SM-48FER
40-49 years, female
693.3
GTEX-WEY5-0626-SM-4LMIA
40-49 years, female
420.3
GTEX-S4UY-1326-SM-4AD4X
40-49 years, female
278.0
GTEX-131XG-1926-SM-5LZVG
50-59 years, female
271.1
GTEX-1QP67-1526-SM-E76P4
40-49 years, female
261.1
GTEX-13D11-1126-SM-5KLYS
50-59 years, female
258.4
GTEX-1PBJI-2026-SM-DPRYF
20-29 years, female
240.1
GTEX-1IKOE-2326-SM-A8N99
30-39 years, female
193.4
GTEX-W5X1-2026-SM-GPRX9
40-49 years, female
190.6
GTEX-1399U-1726-SM-5P9J4
50-59 years, female
176.2
GTEX-15FZZ-0826-SM-6LLJO
30-39 years, female
168.7
GTEX-1IDJU-1126-SM-A9G2S
60-69 years, female
153.2
GTEX-WI4N-2526-SM-4M9QQ
40-49 years, female
151.4
GTEX-T6MO-1126-SM-4DM5D
40-49 years, female
141.3
GTEX-X4EO-2426-SM-4QASD
60-69 years, female
139.7
GTEX-SE5C-0826-SM-HL9T7
40-49 years, female
137.1
GTEX-1RNTQ-1726-SM-F2I39
20-29 years, female
135.9
GTEX-OHPN-1626-SM-GNTBJ
60-69 years, female
134.1
GTEX-Y114-1726-SM-4TT7U
50-59 years, female
128.8
GTEX-1AMEY-0926-SM-72D6G
30-39 years, female
125.7
GTEX-13PVR-1226-SM-5RQJ2
60-69 years, female
125.0
GTEX-ZTPG-1926-SM-HAUZ1
20-29 years, female
117.2
GTEX-1R9PN-0626-SM-E6CR9
40-49 years, female
104.1
GTEX-11ZTT-1826-SM-5CVLN
60-69 years, female
101.7
GTEX-1IE54-2126-SM-GA8ZX
40-49 years, female
95.0
GTEX-XUZC-1026-SM-4BOPY
30-39 years, female
93.8
GTEX-1RDX4-0826-SM-E9TK7
50-59 years, female
85.8
GTEX-WYVS-1526-SM-4OND4
40-49 years, female
83.2
GTEX-13OVJ-2426-SM-5KM3I
50-59 years, female
82.5
GTEX-1LNCM-0926-SM-DHXK5
50-59 years, female
81.1
GTEX-13VXT-1526-SM-5LU3J
20-29 years, female
80.8
GTEX-1HBPH-2726-SM-A96TW
40-49 years, female
80.1
GTEX-14PKV-1226-SM-6871T
20-29 years, female
80.0
GTEX-WXYG-1426-SM-4ONCK
50-59 years, female
76.6
GTEX-PLZ4-2826-SM-3P617
50-59 years, female
73.0
GTEX-QCQG-1426-SM-48U22
50-59 years, female
73.0
GTEX-1F48J-2326-SM-7MKG3
50-59 years, female
67.9
GTEX-1B933-2126-SM-7MGXR
50-59 years, female
66.5
GTEX-1A8FM-2226-SM-7PC1C
50-59 years, female
63.9
GTEX-1PIEJ-1626-SM-E6CP9
20-29 years, female
63.3
GTEX-15EOM-1526-SM-68723
20-29 years, female
60.0
GTEX-17JCI-2326-SM-7IGPC
60-69 years, female
59.1
GTEX-1JN76-1426-SM-AHZ4F
20-29 years, female
59.1
GTEX-T5JW-0426-SM-4DM7M
20-29 years, female
58.9
GTEX-S7SF-1326-SM-4AD4P
20-29 years, female
58.1
GTEX-1GZHY-2426-SM-9JGGK
50-59 years, female
56.6
GTEX-P4PP-2426-SM-3P61L
30-39 years, female
56.3
GTEX-QVJO-3126-SM-COH22
60-69 years, female
55.3
GTEX-146FH-2526-SM-5Q5BP
50-59 years, female
53.1
GTEX-1ICG6-1526-SM-C1YQT
70-79 years, female
52.9
GTEX-1A32A-2726-SM-73KVU
50-59 years, female
51.9
GTEX-R45C-2526-SM-GRR28
60-69 years, female
51.8
GTEX-X8HC-2726-SM-46MUA
50-59 years, female
51.2
GTEX-1QP28-1326-SM-DPRXZ
50-59 years, female
50.9
GTEX-1IDJE-1126-SM-A96SO
50-59 years, female
50.6
GTEX-TMMY-1726-SM-4DXTD
40-49 years, female
49.0
GTEX-ZC5H-2026-SM-5CVN2
40-49 years, female
48.8
GTEX-1NUQO-1726-SM-HK7A8
20-29 years, female
48.6
GTEX-11DXX-1426-SM-5GIDU
60-69 years, female
48.0
GTEX-1JN1M-2126-SM-D4P2X
60-69 years, female
46.9
GTEX-13QBU-1526-SM-5LU3W
40-49 years, female
46.3
GTEX-14JG6-0626-SM-68716
30-39 years, female
46.0
GTEX-OHPL-2426-SM-48TDN
60-69 years, female
45.5
GTEX-13U4I-2126-SM-5LU55
40-49 years, female
44.5
GTEX-14PKU-1226-SM-686ZM
40-49 years, female
43.2
GTEX-1MCC2-1026-SM-EVR5I
30-39 years, female
43.0
GTEX-131YS-2226-SM-5P9G8
60-69 years, female
42.6
GTEX-12ZZX-2026-SM-5LZV9
40-49 years, female
41.6
GTEX-TML8-0926-SM-4DXSJ
40-49 years, female
39.1
GTEX-12WSG-1426-SM-5FQUK
50-59 years, female
38.6
GTEX-14BMU-1726-SM-5TDE8
20-29 years, female
38.4
GTEX-1CAMS-2126-SM-7MXTF
40-49 years, female
37.3
GTEX-1S5ZU-2326-SM-EAZ5B
20-29 years, female
37.2
GTEX-15ER7-2326-SM-7KUN3
20-29 years, female
35.2
GTEX-PX3G-2426-SM-48TZZ
20-29 years, female
34.6
GTEX-13W3W-1526-SM-5LU5I
60-69 years, female
33.9
GTEX-1OJC4-2026-SM-E6CQW
50-59 years, female
33.5
GTEX-Q734-0726-SM-48TZP
40-49 years, female
32.6
GTEX-RU1J-0826-SM-46MUU
20-29 years, female
32.5
GTEX-U3ZN-1026-SM-4DXTC
30-39 years, female
32.3
GTEX-14DAQ-2226-SM-5YYAD
60-69 years, female
31.9
GTEX-SN8G-2426-SM-EVR31
50-59 years, female
30.9
GTEX-1QPFJ-1726-SM-EXOJU
30-39 years, female
30.4
GTEX-1LGOU-1026-SM-DHXL4
20-29 years, female
29.8
GTEX-1J1OQ-1626-SM-CE6TB
40-49 years, female
28.7
GTEX-1C475-0426-SM-7P8OU
40-49 years, female
28.1
GTEX-X15G-1726-SM-4PQZN
50-59 years, female
27.8
GTEX-1LVAM-1826-SM-DHXKR
50-59 years, female
27.5
GTEX-PWN1-2426-SM-48TDD
40-49 years, female
27.1
GTEX-1QEPI-2726-SM-DPRZ6
60-69 years, female
26.9
GTEX-POMQ-1426-SM-3P61D
20-29 years, female
26.9
GTEX-1LGRB-2326-SM-CNNPU
50-59 years, female
25.9
GTEX-ZYFG-1726-SM-5GZZB
60-69 years, female
25.7
GTEX-1399S-2126-SM-G8OM9
30-39 years, female
25.6
GTEX-133LE-1226-SM-5IFGC
20-29 years, female
25.2
GTEX-1HSGN-2426-SM-C1YRI
40-49 years, female
24.9
GTEX-S4P3-0926-SM-4AD54
50-59 years, female
24.4
GTEX-11EM3-1726-SM-5N9D1
20-29 years, female
24.3
GTEX-QDT8-2226-SM-EZ6LT
30-39 years, female
23.9
GTEX-ZP4G-0626-SM-4WWF1
20-29 years, female
23.3
GTEX-16MT8-2226-SM-6LPK2
60-69 years, female
22.5
GTEX-1MA7W-1426-SM-EV7A1
20-29 years, female
22.5
GTEX-1F6RS-2726-SM-7MKHA
60-69 years, female
22.3
GTEX-1MCYP-1426-SM-F2I3H
20-29 years, female
22.3
GTEX-1KANC-1026-SM-D3LAA
50-59 years, female
22.1
GTEX-11P81-1526-SM-5P9GS
30-39 years, female
21.2
GTEX-13N11-0526-SM-5IJFI
50-59 years, female
21.1
GTEX-W5WG-0926-SM-4RTX9
50-59 years, female
20.4
GTEX-YFC4-2726-SM-5IFJW
40-49 years, female
20.3
GTEX-1R9JW-1226-SM-F2I1P
30-39 years, female
19.5
GTEX-13OVI-0726-SM-5L3DD
60-69 years, female
19.4
GTEX-1AMFI-1426-SM-731EL
50-59 years, female
19.3
GTEX-P4QT-2426-SM-3NMCL
50-59 years, female
19.3
GTEX-PWCY-1326-SM-48TCU
20-29 years, female
19.2
GTEX-12WSK-1926-SM-5LZVK
40-49 years, female
18.8
GTEX-YJ8O-1026-SM-5CVM5
40-49 years, female
18.8
GTEX-131XW-2726-SM-HL9U9
50-59 years, female
18.6
GTEX-T2IS-2026-SM-4DM6W
20-29 years, female
18.1
GTEX-15DDE-2326-SM-6AJA8
50-59 years, female
17.5
GTEX-11VI4-1026-SM-5EQM1
40-49 years, female
16.8
GTEX-WWYW-2726-SM-4MVOP
50-59 years, female
16.4
GTEX-18D9A-0826-SM-718C1
30-39 years, female
16.1
GTEX-UJHI-1226-SM-4IHLR
50-59 years, female
16.0
GTEX-XUW1-0126-SM-4BOOQ
50-59 years, female
15.7
GTEX-13FTX-0926-SM-5IFF7
20-29 years, female
15.6
GTEX-13X6H-1026-SM-5MR8F
50-59 years, female
15.5
GTEX-145MI-2626-SM-5QGQ8
60-69 years, female
15.5
GTEX-ZZPU-2126-SM-5EGIU
50-59 years, female
15.5
GTEX-12WSJ-1226-SM-5LU91
40-49 years, female
15.2
GTEX-11EMC-1726-SM-5H11P
60-69 years, female
15.1
GTEX-1I4MK-1526-SM-CE6T1
50-59 years, female
15.0
GTEX-15DYW-2626-SM-6LPK7
60-69 years, female
14.8
GTEX-ZLWG-0926-SM-4WWC3
50-59 years, female
14.7
GTEX-11XUK-1626-SM-5GU5O
40-49 years, female
14.6
GTEX-15SDE-0926-SM-6LPIA
50-59 years, female
14.4
GTEX-13O3O-2726-SM-5KM35
60-69 years, female
14.2
GTEX-183WM-1926-SM-72D5F
70-79 years, female
14.1
GTEX-RU72-2226-SM-46MUE
50-59 years, female
14.0
GTEX-1F52S-2226-SM-7MXVE
60-69 years, female
13.8
GTEX-ZVT2-0326-SM-5E44G
50-59 years, female
13.7
GTEX-17F9Y-2226-SM-HL9UK
70-79 years, female
13.3
GTEX-132AR-1426-SM-5IFF1
50-59 years, female
12.7
GTEX-11I78-1926-SM-59878
50-59 years, female
11.8
GTEX-1269C-1826-SM-5N9E1
60-69 years, female
11.7
GTEX-16NGA-0426-SM-7LG6K
40-49 years, female
11.5
GTEX-11GSP-0226-SM-5A5KV
60-69 years, female
11.4
GTEX-ZAJG-2726-SM-5S2MU
50-59 years, female
11.4
GTEX-12WSD-2726-SM-59HLR
60-69 years, female
11.2
GTEX-1313W-2726-SM-5P9IX
50-59 years, female
11.2
GTEX-14PJM-2426-SM-686ZC
50-59 years, female
11.2
GTEX-ZYY3-2726-SM-5EGH4
60-69 years, female
11.1
GTEX-1EWIQ-2226-SM-7MGXJ
70-79 years, female
11.0
GTEX-14AS3-1326-SM-5RQJE
40-49 years, female
10.9
GTEX-13PL7-2326-SM-5L3FY
60-69 years, female
10.6
GTEX-1K9T9-2426-SM-DHXKT
50-59 years, female
10.2
GTEX-145ME-1226-SM-5MR87
40-49 years, female
9.9
GTEX-1I1CD-2026-SM-GA91R
60-69 years, female
9.7
GTEX-15UF6-2026-SM-6LPI3
70-79 years, female
9.5
GTEX-139D8-2426-SM-5KM3A
30-39 years, female
9.2
GTEX-1F5PL-1626-SM-7MXTY
40-49 years, female
9.2
GTEX-ZPIC-1426-SM-4WWCP
40-49 years, female
9.2
GTEX-S32W-1226-SM-4AD67
50-59 years, female
8.3
GTEX-XYKS-1726-SM-4E3IO
60-69 years, female
8.2
GTEX-14BIN-1426-SM-664NI
50-59 years, female
7.9
GTEX-1H1CY-1926-SM-9WG7X
60-69 years, female
7.9
GTEX-ZE7O-2226-SM-GNTC2
50-59 years, female
7.9
GTEX-1HCUA-1326-SM-9WPP6
50-59 years, female
7.7
GTEX-11ZVC-1426-SM-5EGGA
50-59 years, female
7.6
GTEX-13QIC-1526-SM-5IJFL
60-69 years, female
7.6
GTEX-OHPK-2426-SM-3MJGH
50-59 years, female
7.6
GTEX-RTLS-2326-SM-46MUH
60-69 years, female
7.5
GTEX-XV7Q-1426-SM-4BRWA
40-49 years, female
7.3
GTEX-16NPV-2326-SM-HL9UF
50-59 years, female
7.0
GTEX-11ZTS-1926-SM-5CVLA
60-69 years, female
6.9
GTEX-XMD3-2326-SM-4AT5H
50-59 years, female
6.7
GTEX-ZVT3-2626-SM-5GU5L
60-69 years, female
6.7
GTEX-RWS6-1026-SM-47JXD
60-69 years, female
6.6
GTEX-TSE9-2226-SM-4DXUR
60-69 years, female
6.6
GTEX-P78B-1926-SM-3P616
40-49 years, female
6.4
GTEX-1GN1W-1426-SM-9JGHP
50-59 years, female
6.3
GTEX-15SHU-2726-SM-HAV2W
40-49 years, female
6.2
GTEX-Y3IK-2026-SM-4YCDG
50-59 years, female
6.1
GTEX-1F88E-2026-SM-7MXVP
60-69 years, female
6.0
GTEX-S341-0726-SM-4AD5R
40-49 years, female
6.0
GTEX-14PN3-1526-SM-6ETZM
60-69 years, female
5.9
GTEX-1H2FU-2326-SM-9WG7R
60-69 years, female
5.8
GTEX-18A7A-2626-SM-7LG6L
50-59 years, female
5.5
GTEX-1LKK1-1626-SM-EVR4Y
50-59 years, female
5.2
GTEX-WYBS-2426-SM-4ONDI
60-69 years, female
4.4
GTEX-13NZ8-2526-SM-H65ZM
60-69 years, female
4.2
GTEX-145LS-2326-SM-5TDCY
60-69 years, female
4.1
GTEX-1J8JJ-0826-SM-AHZ3F
60-69 years, female
2.6
GTEX-13SLX-2426-SM-664OM
50-59 years, female
1.9
Show allShow less
OVARY - FANTOM5 CAGEi
RNA expression in human tissues obtained through Cap Analysis of Gene Expression (CAGE) generated by the FANTOM5 project are reported as Scaled Tags Per Million.
Max subtype Scaled Tags Per Millioni
Max subtype Scaled Tags Per Million is the value for the subtype with the largest average Scaled Tags Per Million across the subtype samples.
Max subtype nTPM is the value for the subtype with the largest average nTPM across the subtype samples.
127.7
Macaque sample
Sample description
nTPM
Ovary nTPM: 127.7
Samples: 1
Max nTPM: 127.7
Min nTPM: 127.7
Sample A
127.7
OVARY - Pig RNA-seqi
RNA-seq data obtained from pig brain is reported as nTPM. Normal distribution across the dataset is visualized with box plots, shown as median and 25th and 75th percentiles. Points are displayed as outliers if they are above or below 1.5 times the interquartile range. nTPM values of the individual samples are presented next to the box plot.
Max subtype nTPMi
Max subtype nTPM is the value for the subtype with the largest average nTPM across the subtype samples.
48.4
Pig sample
Sample description
nTPM
Ovary nTPM: 48.4
Samples: 2
Max nTPM: 67.0
Min nTPM: 29.7
Sample A
Female
67.0
Sample B
Female
29.7
OVARY - Mouse RNA-seqi
RNA-seq data obtained from mouse brain is reported as nTPM. Normal distribution across the dataset is visualized with box plots, shown as median and 25th and 75th percentiles. Points are displayed as outliers if they are above or below 1.5 times the interquartile range. nTPM values of the individual samples are presented next to the box plot.
Max subtype nTPMi
Max subtype nTPM is the value for the subtype with the largest average nTPM across the subtype samples.
41.4
Mouse sample
Sample description
nTPM
Ovary nTPM: 41.4
Samples: 2
Max nTPM: 45.3
Min nTPM: 37.5
Sample A
45.3
Sample B
37.5
OVARY - Rat RNA-seq
Max subtype nTPMi
Max subtype nTPM is the value for the subtype with the largest average nTPM across the subtype samples.
32.5
Rat sample
Sample description
nTPM
Ovary nTPM: 32.5
Samples: 2
Max nTPM: 37.9
Min nTPM: 27.0
Sample A
27.0
Sample A
37.9
We use cookies to enhance the usability of our website. If you continue, we'll assume that you are happy to receive all cookies. More information. Don't show this again.


 The Human Protein Atlas project is funded