USP40
HPA
RESOURCES
  • TISSUE
  • BRAIN
  • SINGLE CELL
  • IMMUNE CELL
  • SUBCELLULAR
  • CANCER
  • BLOOD
  • CELL LINE
  • STRUCTURE
  • INTERACTION
  • METABOLIC
  • ISOFORM
  • EVOLUTIONARY
ABOUT
  • INTRODUCTION
  • HISTORY
  • ORGANIZATION
  • PUBLICATIONS
  • ACKNOWLEDGMENTS
  • CONTACT
NEWS
  • NEWS ARTICLES
  • PRESS ROOM
LEARN
  • DICTIONARY
  • PROTEIN CLASSES
  • PROTEIN EVIDENCE
  • METHODS
  • AI IMPLEMENTATIONS
  • EDUCATIONAL VIDEOS
DATA
  • DOWNLOADABLE DATA
  • PUBLICATION DATA
  • RELEASE HISTORY
HELP
  • HELP & FAQ
  • ANTIBODY AVAILABILITY
  • DISCLAIMER
  • PRIVACY STATEMENT
  • LICENCE & CITATION
Fields »
Search result

Field
Term
Gene name
Class
Subclass
Category
Keyword
Chromosome
External id
Tissue
Cell type
Expression
Antibody panel
Tissue
Main location
Patient ID
Annotation
Tissue
Category
Tau score
Tissue
Category
Tau score
Tissue
Category
Tau score
Cluster
Reliability
Region
Niche
Category
Brain region
Category
Tau score
Brain domain
Category
Tau score
Cell type
Category
Tau score
Cell type
Category
Tau score
Brain region
Category
Tau score
Brain region
Category
Tau score
Brain region
Category
Tau score
Brain region
Category
Tau score
Cluster
Reliability
Cell type
Category
Tau score
Cell type group
Category
Tau score
Single cell
Category
Tau score
Single cell
Category
Tau score
Annotation
Annotation
Annotation
Tissue
Cell type
Enrichment
Cluster
Cell type
Category
Tau score
Cell lineage
Category
Tau score
Cluster
Location
Searches
Location
Cell line
Class
Type
Phase
Reliability
Cancer
Prognosis
Cancer
Regulation
Cancer
Regulation
Cancer
Category
Cancer
Category
Tau score
Correlation
Correlation
Cancer
Category
Tau score
Cluster
Variants
Source
PTM
ipTM
Interacting gene (ensg_id)
Type
Number of interactions
Type
Heterodimer
Subsystem
Isoforms
Specificity
Expression
Species
Ortholog
Type
Species
Tissue
Category
Species
Tau score
Data
Category
Data
Species
Category
Category
Category
Category
Category
Validation
Validation
Validation
Validation
Antibodies
Data type
Column


BETA
  • SUMMARY

  • TISSUE

  • BRAIN

  • SINGLE CELL

  • IMMUNE

  • SUBCELL

  • CANCER

  • BLOOD

  • CELL LINE

  • STRUCTURE

  • INTERACTION

  • METABOLIC

  • ISOFORM

  • EVOLUTION

  • USP40
PROTEIN SUMMARY GENE INFORMATION RNA DATA ANTIBODY DATA
Hippocampal formation Amygdala Basal ganglia Midbrain Spinal cord Cerebral cortex Cerebellum Hypothalamus Choroid plexus Retina Thyroid gland Parathyroid gland Adrenal gland Pituitary gland Lung Salivary gland Esophagus Tongue Stomach Colon Rectum Small intestine Duodenum Liver Gallbladder Pancreas Kidney Urinary bladder Testis Epididymis Prostate Seminal vesicle Vagina Breast Cervix Endometrium Fallopian tube Ovary Placenta Blood vessel Heart muscle Skeletal muscle Smooth muscle Adipose tissue Skin Bone marrow Lymph node Appendix Tonsil Spleen Thymus
USP40 INFORMATION
Proteini

Full gene name according to HGNC.

Ubiquitin specific peptidase 40
Gene namei

Official gene symbol, which is typically a short form of the gene name, according to HGNC.

USP40 (FLJ10785)
Protein classi

Assigned HPA protein class(es) for the encoded protein(s).

Enzymes
Protein evidence Evidence at protein level (all genes)
Number of transcriptsi

Number of protein-coding transcripts from the gene as defined by Ensembl.

7
Protein interactions Interacting with 8 proteins
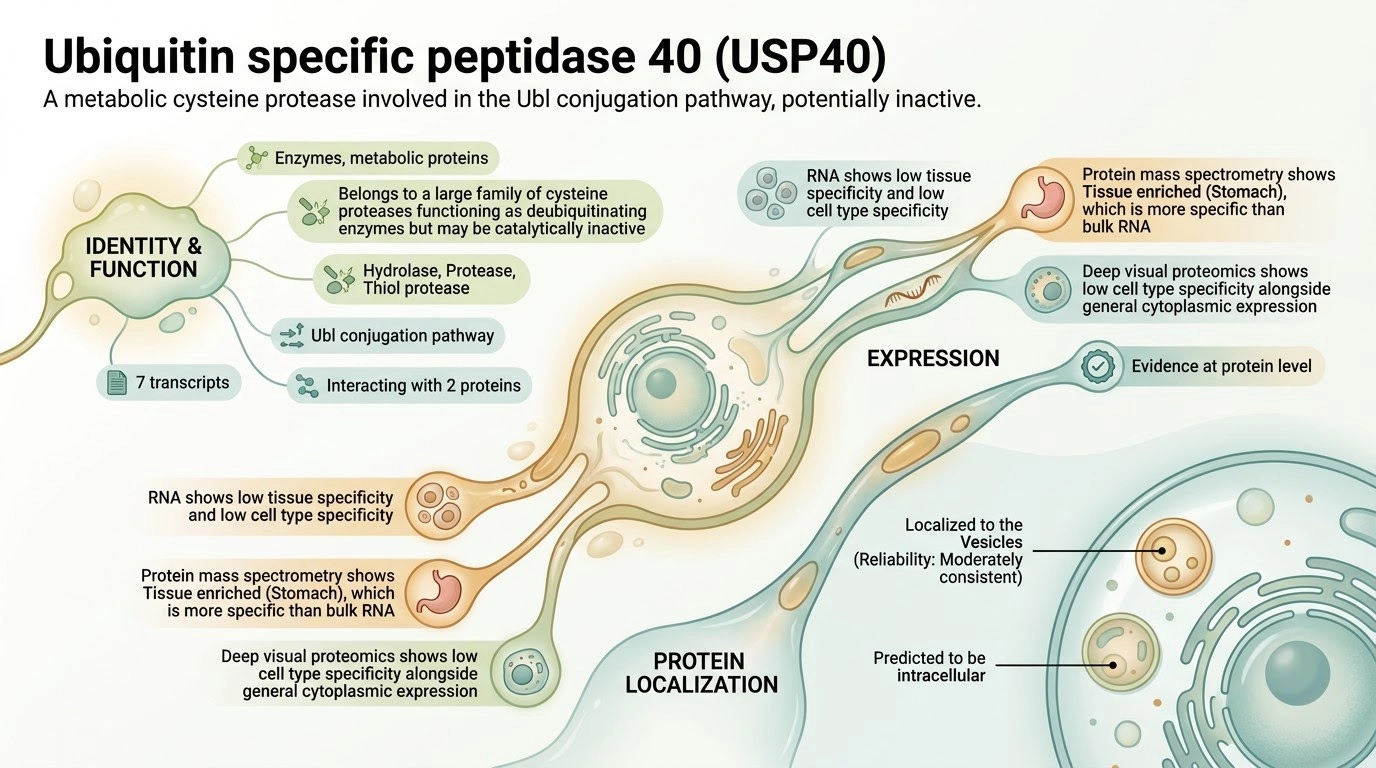
USP40 AI GENERATED INFOGRAPHICi

This infographic was generated by AI (Gemini) using only data presented in the Human Protein Atlas v25. It is a quick overview and may contain errors or simplifications, so please check the full data on this gene page before drawing conclusions.

Read more
PROTEIN EXPRESSION AND LOCALIZATION
Tissue profilei

A summary of the overall protein expression profile across the analyzed normal tissues based on knowledge-based annotation, presented in the Tissue resource.

"Estimation of protein expression could not be performed. View primary data." is shown for genes where available RNA-seq and gene/protein characterization data in combination with immunohistochemistry data has been evaluated as not sufficient to yield a reliable estimation of the protein expression profile.

General cytoplasmic expression.
Tissue specificity (MS) Tissue enriched (Stomach)
Cell type specificity (DVP) Low cell type specificity
Subcellular locationi

Main subcellular location based on data generated in the subcellular section of the Human Protein Atlas.

Localized to the Vesicles In addition localized to the Focal adhesion sites
Predicted locationi

All transcripts of all genes have been analyzed regarding the location(s) of corresponding protein based on prediction methods for signal peptides and transmembrane regions.

  • Genes with at least one transcript predicted to encode a secreted protein, according to prediction methods or to UniProt location data, have been further annotated and classified with the aim to determine if the corresponding protein(s) are secreted or actually retained in intracellular locations or membrane-attached.
  • Remaining genes, with no transcript predicted to encode a secreted protein, will be assigned the prediction-based location(s).

The annotated location overrules the predicted location, so that a gene encoding a predicted secreted protein that has been annotated as intracellular will have intracellular as the final location.

Intracellular
TISSUE RNA EXPRESSION
Tissue specificityi

The RNA specificity category is based on normalized mRNA expression levels in the consensus dataset, calculated from the RNA expression levels in samples from HPA and GTEX. The categories include: tissue enriched, group enriched, tissue enhanced, low tissue specificity and not detected.

Low tissue specificity
Tissue expression clusteri

The RNA data was used to cluster genes according to their expression across tissues. Clusters contain genes that have similar expression patterns, and each cluster has been manually annotated to describe common features in terms of function and specificity.

Epididymis - Mixed function (mainly)
Brain specificityi

The regional specificity category is based on mRNA expression levels in the analysed brain samples, grouped into 13 main brain regions and calculated for the three different species. All brain expression profiles are based on data from HPA. The specificity categories include: regionally enriched, group enriched, regionally enhanced, low regional specificity and not detected. The classification rules are the same used for the tissue specificity category

Low domain specificity
Brain expression clusteri

The RNA data was used to cluster genes according to their expression across tissues. Clusters contain genes that have similar expression patterns, and each cluster has been manually annotated to describe common features in terms of function and specificity.

White matter - Signal transduction (mainly)
Isoform expression categoryi

The expression category reflects the overall expression pattern for the gene based on expression profiles for all individual isoforms.

Read more
Many expressed
Evolutionary conservation categoryi

Conservation category is a categoric annotation that intends to capture the available pairwise species overlap annotations into one metric. The categories range from: Complete, Partial and Minimal Conservation for conserved genes; and Tissue elevation shift, human specific tissue elevated, Non-Human tissue elevated, Human specific detected and Human not detected for non conserved genes.

Complete conservation (Low tissue specificity)
CELL TYPE RNA EXPRESSION
Single cell type specificityi

The RNA specificity category is based on mRNA expression levels in the analyzed cell types based on scRNA-seq data from normal tissues. The categories include: cell type enriched, group enriched, cell type enhanced, low cell type specificity and not detected.

Low cell type specificity
Single cell type
expression clusteri

The RNA data was used to cluster genes according to their expression across single cell types. Clusters contain genes that have similar expression patterns, and each cluster has been manually annotated to describe common features in terms of function and specificity.

Non-specific - Transcription & Protein QC (mainly)
Bulk RNA deconvolution classificationi

Genes can have enriched specificity in different cell types in one or several tissues, or be enriched in a core cell type that appears in many different tissues.

No predicted cell type specificity
Immune cell specificityi

The RNA specificity category is based on mRNA expression levels in the analyzed samples based on data from HPA. The categories include: cell type enriched, group enriched, cell type enhanced, low cell type specificity and not detected.

Low immune cell specificity
Immune cell
expression clusteri

The RNA data was used to cluster genes according to their expression across single cell types. Clusters contain genes that have similar expression patterns, and each cluster has been manually annotated to describe common features in terms of function and specificity.

Non-specific - Mitochondria (mainly)
CANCER & CELL LINES
Cancer specificity (RNA)i

Specificity of RNA expression (TCGA dataset) across 21 cancer types is categorized as either cancer enriched, group enriched, cancer enhanced, low cancer specificity or not detected.

Low cancer specificity
Cancer specificity (Protein)i

Specificity of protein abundance in tumor samples from 25 cancer types, measured by mass spectrometry (ProteinTalks DB dataset), is categorized as cancer enriched, group enriched, cancer enhanced, low cancer specificity or not detected.

Low cancer specificity
Cell line
expression clusteri

The RNA data was used to cluster genes according to their expression across cell lines. Clusters contain genes that have similar expression patterns, and each cluster has been manually annotated to describe common features in terms of function and specificity.

Non-specific - Mitochondria & RNA binding (mainly)
Cell line specificityi

RNA specificity category based on RNA sequencing data from cancer cell lines in the Human Protein Atlas grouped according to type of cancer. Genes are classified into six different categories (enriched, group enriched, enhanced, low specificity and not detected) according to their RNA expression levels across the panel of cell lines.

Low cancer specificity
PROTEINS IN BLOOD
Detected in blood by
immunoassayi

The blood-based immunoassay category applies to actively secreted proteins and is based on plasma or serum protein concentrations established with enzyme-linked immunosorbent assays, compiled from a literature search. The categories include: detected and not detected, where detection refers to a concentration found in the literature search.

No (not applicable)
Detected in blood by
mass spectrometryi

Detection or not of the gene in blood, based on spectral count estimations from a publicly available mass spectrometry-based plasma proteomics dataset obtained from the PeptideAtlas.

No
Proximity extension assayi

Indicates whether the protein has been measured (Data available) or not (Not available) using the Olink Explore HT proximity extension assay platform.

Not available
SomaScani

Indicates whether the protein has been measured (Data available) or not (Not available) using the SomaScan 11K platform.

Not available
PROTEIN FUNCTION
Protein function (UniProt)i

Useful information about the protein provided by UniProt.

Deubiquitinating enzyme that plays a key role in maintaining endothelial cell (EC) barrier integrity and regulating apoptosis and inflammation. Stabilizes Claudin-1/CLDN1 by cleaving its polyubiquitin chains, thereby protecting tight junction structure 1. Prevents EC barrier disruption by inhibiting RhoA activation and reducing phosphorylation of myosin light chain and cofilin. Suppresses EC inflammation by inhibiting NF-kappa-B activation, decreasing ICAM1 expression, and reducing leukocyte adhesion to ECs 2. Mediates these protective effects in part via deubiquitination and inactivation of heat shock protein 90-beta/HSP90AB1 3. Targets CFLAR for 'Lys-48'-linked deubiquitination, stabilizing its protein levels. This interaction is facilitated by the adapter protein GMEB1, which enhances USP40-CFLAR binding. Through CFLAR stabilization, USP40 inhibits pro-caspase-8 activation and protects against apoptosis 4. Additionally, USP40 stabilizes HINT1, an activator of p53/TP53, thereby maintaining p53/TP53 levels and sustaining the HINT1-p53/TP53 axis (By similarity).... show less
Molecular function (UniProt)i

Keywords assigned by UniProt to proteins due to their particular molecular function.

Hydrolase, Protease, Thiol protease
Biological process (UniProt)i

Keywords assigned by UniProt to proteins because they are involved in a particular biological process.

Ubl conjugation pathway
Gene summary (Entrez)i

Useful information about the gene from Entrez

Modification of cellular proteins by ubiquitin is an essential regulatory mechanism controlled by the coordinated action of multiple ubiquitin-conjugating and deubiquitinating enzymes. USP40 belongs to a large family of cysteine proteases that function as deubiquitinating enzymes (Quesada et al., 2004).[supplied by OMIM, Mar 2008]... show less

Contact

  • NEWS ARTICLES
  • PRESS ROOM

The Project

  • INTRODUCTION
  • ORGANIZATION
  • PUBLICATIONS

The Human Protein Atlas

  • DOWNLOADABLE DATA
  • LICENCE & CITATION
  • HELP & FAQ
KAW logo The Human Protein Atlas project is funded
by the Knut and Alice Wallenberg Foundation.

Facebook logo X logo Bluesky logo Linkedin logo RSS feed logo contact@proteinatlas.org
GCBR logo Elixir core logo SciLifeLab logo Uppsala university logo KI logo KTH logo
We use cookies to enhance the usability of our website. If you continue, we'll assume that you are happy to receive all cookies. More information. Don't show this again.