AP3B2
HPA
RESOURCES
  • TISSUE
  • BRAIN
  • SINGLE CELL
  • IMMUNE CELL
  • SUBCELLULAR
  • CANCER
  • BLOOD
  • CELL LINE
  • STRUCTURE
  • INTERACTION
  • METABOLIC
  • ISOFORM
  • EVOLUTIONARY
ABOUT
  • INTRODUCTION
  • HISTORY
  • ORGANIZATION
  • PUBLICATIONS
  • ACKNOWLEDGMENTS
  • CONTACT
NEWS
  • NEWS ARTICLES
  • PRESS ROOM
LEARN
  • DICTIONARY
  • PROTEIN CLASSES
  • PROTEIN EVIDENCE
  • METHODS
  • AI IMPLEMENTATIONS
  • EDUCATIONAL VIDEOS
DATA
  • DOWNLOADABLE DATA
  • PUBLICATION DATA
  • RELEASE HISTORY
HELP
  • HELP & FAQ
  • ANTIBODY AVAILABILITY
  • DISCLAIMER
  • PRIVACY STATEMENT
  • LICENCE & CITATION
Fields »
Search result

Field
Term
Gene name
Class
Subclass
Category
Keyword
Chromosome
External id
Tissue
Cell type
Expression
Antibody panel
Tissue
Main location
Patient ID
Annotation
Tissue
Category
Tau score
Tissue
Category
Tau score
Tissue
Category
Tau score
Cluster
Reliability
Region
Niche
Category
Brain region
Category
Tau score
Brain domain
Category
Tau score
Cell type
Category
Tau score
Cell type
Category
Tau score
Brain region
Category
Tau score
Brain region
Category
Tau score
Brain region
Category
Tau score
Brain region
Category
Tau score
Cluster
Reliability
Cell type
Category
Tau score
Cell type group
Category
Tau score
Single cell
Category
Tau score
Single cell
Category
Tau score
Annotation
Annotation
Annotation
Tissue
Cell type
Enrichment
Cluster
Cell type
Category
Tau score
Cell lineage
Category
Tau score
Cluster
Location
Searches
Location
Cell line
Class
Type
Phase
Reliability
Cancer
Prognosis
Cancer
Regulation
Cancer
Regulation
Cancer
Category
Cancer
Category
Tau score
Correlation
Correlation
Cancer
Category
Tau score
Cluster
Variants
Source
PTM
ipTM
Interacting gene (ensg_id)
Type
Number of interactions
Type
Heterodimer
Subsystem
Isoforms
Specificity
Expression
Species
Ortholog
Type
Species
Tissue
Category
Species
Tau score
Data
Category
Data
Species
Category
Category
Category
Category
Category
Validation
Validation
Validation
Validation
Antibodies
Data type
Column


BETA
  • SUMMARY

  • TISSUE

  • BRAIN

  • SINGLE CELL

  • IMMUNE

  • SUBCELL

  • CANCER

  • BLOOD

  • CELL LINE

  • STRUCTURE

  • INTERACTION

  • METABOLIC

  • ISOFORM

  • EVOLUTION

  • AP3B2
ISOFORM
Isoform resource
Isoform methods
GENERAL INFORMATIONi

General description of the gene and the encoded protein(s) using information from HGNC and Ensembl, as well as predictions made by the Human Protein Atlas project.

Gene namei

Official gene symbol, which is typically a short form of the gene name, according to HGNC.

AP3B2
Gene descriptioni

Full gene name according to HGNC.

Adaptor related protein complex 3 subunit beta 2
Protein classi

Assigned HPA protein class(es) for the encoded protein(s).

Disease related genes
Human disease related genes
Predicted locationi

All transcripts of all genes have been analyzed regarding the location(s) of corresponding protein based on prediction methods for signal peptides and transmembrane regions.

  • Genes with at least one transcript predicted to encode a secreted protein, according to prediction methods or to UniProt location data, have been further annotated and classified with the aim to determine if the corresponding protein(s) are secreted or actually retained in intracellular locations or membrane-attached.
  • Remaining genes, with no transcript predicted to encode a secreted protein, will be assigned the prediction-based location(s).

The annotated location overrules the predicted location, so that a gene encoding a predicted secreted protein that has been annotated as intracellular will have intracellular as the final location.

Intracellular
Number of transcriptsi

Number of protein-coding transcripts from the gene as defined by Ensembl.

16
HUMAN PROTEIN ATLAS INFORMATIONi

Summary of RNA expression analysis and annotation data generated within the Human Protein Atlas project.

Tissue specificity HPA (aggregated)i

The aggregated tissue specificity category corresponds to the combined unique specificity categories of all individual isoforms for the gene, based on HPA RNA-seq data

Read more
Enhanced, enriched
Tissue specificity GTEx (aggregated)i

The aggregated tissue specificity category corresponds to the combined unique specificity categories of all individual isoforms for the gene, based on GTEx RNA-seq data.

Read more
Enhanced, enriched
Tissue expression
cluster (RNA)i

The RNA data was used to cluster genes according to their expression across tissues. Clusters contain genes that have similar expression patterns, and each cluster has been manually annotated to describe common features in terms of function and specificity.

Cerebellum - Synaptic function (mainly)
Expression category (HPA)i

The expression category reflects the overall expression pattern for the gene based on expression profiles for all individual isoforms.

Read more
Dominant isoform, some expressed
Expression category (GTEx)i

The expression category reflects the overall expression pattern for the gene based on expression profiles for all individual isoforms.

Read more
Dominant isoform, many expressed
Tissue specificity (RNA)i

The RNA specificity category is based on mRNA expression levels in the consensus dataset which is calculated from the RNA expression levels in samples from HPA and GTEX. The categories include: tissue enriched, group enriched, tissue enhanced, low tissue specificity and not detected.

Group enriched (Brain, Parathyroid gland, Pituitary gland, Retina)
TRANSCRIPT OVERVIEW
RNA ISOFORM EXPRESSION (HPA)
Expression
Predicted location
Organ
Expression
Alphabetical
Expression: dominant isoform, some expressed
Specificity: enhanced;enriched
RNA ISOFORM EXPRESSION (GTEx)
Expression
Predicted location
Organ
Expression
Alphabetical
Expression: dominant isoform, many expressed
Specificity: enhanced;enriched
PROTEIN INFORMATIONi

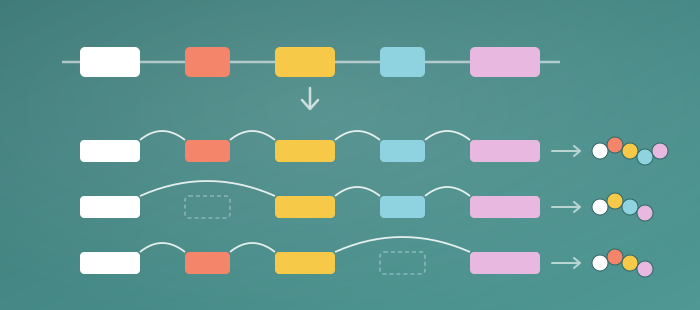
The protein information section displays alternative protein-coding transcripts (splice variants) encoded by this gene according to the Ensembl database.

The Splice variant identifier links to the Ensembl website protein summary for the selected splice variant. The data in the Swissprot and TrEMBL columns links to corresponding pages in the UniProt database.

The protein classes assigned to this protein are shown if expanding the data in the protein class column. Parent protein classes are in bold font and subclasses are listed under the parent class.

The length of the protein (amino acid residues according to Ensembl), molecular mass (kDalton), predicted signal peptide and number of predicted transmembrane region(s) according to in-house majority decision methods based on sets of predictors are also reported.

Splice variant SwissProt TrEMBL Protein class Length & mass Signal peptide
(predicted)
Transmembrane regions
(predicted)
AP3B2-201 A0A5F9UJV3
Predicted intracellular proteins
Human disease related genes
Protein evidence (Ezkurdia et al 2014)
1088 aa
119.7 kDa
No 0
AP3B2-202 Q13367
Predicted intracellular proteins
Disease related genes
Human disease related genes
Mapped to neXtProt
Protein evidence (Ezkurdia et al 2014)
Show all
1050 aa
115.3 kDa
No 0
AP3B2-203 Q13367
Predicted intracellular proteins
Disease related genes
Human disease related genes
Mapped to neXtProt
Protein evidence (Ezkurdia et al 2014)
Show all
1101 aa
121.2 kDa
No 0
AP3B2-205 A0A590UJ44
Predicted intracellular proteins
Human disease related genes
Protein evidence (Ezkurdia et al 2014)
146 aa
16.1 kDa
No 0
AP3B2-207 F5GWU4
Predicted intracellular proteins
Human disease related genes
Protein evidence (Ezkurdia et al 2014)
193 aa
21.7 kDa
No 0
AP3B2-208 F5GYB0
Predicted intracellular proteins
Human disease related genes
Protein evidence (Ezkurdia et al 2014)
141 aa
15.5 kDa
No 0
AP3B2-213 A0A2R8Y2A8
Predicted intracellular proteins
Human disease related genes
Protein evidence (Ezkurdia et al 2014)
1125 aa
123.9 kDa
No 0
AP3B2-214 A0A590UKC4
Predicted intracellular proteins
Human disease related genes
Protein evidence (Ezkurdia et al 2014)
1130 aa
124.6 kDa
No 0
AP3B2-217 A0A590UJE5
Predicted intracellular proteins
Human disease related genes
Protein evidence (Ezkurdia et al 2014)
718 aa
78.9 kDa
No 0
AP3B2-220 A0A590UKD3
Predicted intracellular proteins
Human disease related genes
Protein evidence (Ezkurdia et al 2014)
528 aa
58.7 kDa
No 0
AP3B2-221 A0A590UK64
Predicted intracellular proteins
Human disease related genes
Protein evidence (Ezkurdia et al 2014)
77 aa
8.3 kDa
No 0
AP3B2-222 A0A590UJW5
Predicted intracellular proteins
Human disease related genes
Protein evidence (Ezkurdia et al 2014)
508 aa
56.9 kDa
No 0
AP3B2-224 A0A590UK30
Predicted intracellular proteins
Human disease related genes
Protein evidence (Ezkurdia et al 2014)
144 aa
16.7 kDa
No 0
AP3B2-225 A0A590UJ60
Predicted intracellular proteins
Human disease related genes
Protein evidence (Ezkurdia et al 2014)
992 aa
109.4 kDa
No 0
AP3B2-229 Q13367
Predicted intracellular proteins
Disease related genes
Human disease related genes
Mapped to neXtProt
Protein evidence (Kim et al 2014)
Protein evidence (Ezkurdia et al 2014)
Show all
1082 aa
119.1 kDa
No 0
AP3B2-231 A0A590UK04
Predicted intracellular proteins
Human disease related genes
Protein evidence (Ezkurdia et al 2014)
1025 aa
112.6 kDa
No 0
Show allShow less

Contact

  • NEWS ARTICLES
  • PRESS ROOM

The Project

  • INTRODUCTION
  • ORGANIZATION
  • PUBLICATIONS

The Human Protein Atlas

  • DOWNLOADABLE DATA
  • LICENCE & CITATION
  • HELP & FAQ
KAW logo The Human Protein Atlas project is funded
by the Knut and Alice Wallenberg Foundation.

Facebook logo X logo Bluesky logo Linkedin logo RSS feed logo contact@proteinatlas.org
GCBR logo Elixir core logo SciLifeLab logo Uppsala university logo KI logo KTH logo
We use cookies to enhance the usability of our website. If you continue, we'll assume that you are happy to receive all cookies. More information. Don't show this again.