We use cookies to enhance the usability of our website. If you continue, we'll assume that you are happy to receive all cookies. More information. Don't show this again.
RNA expression in the single cell type clusters identified in this tissue visualized by a UMAP plot (top) and a bar chart (bottom).
- UMAP PLOT visualizes the cells in each cluster; where each dot corresponds to a cell. For each individual cell, mouseover reveals read count and which cluster the cell belongs to. Hovering over a cluster name will highlight the corresponding cluster in the bar chart below. There are 2 options for color schemes: 1) cell type color, which is based on cell type groups used in the Single cell type part of the Single cell resource and 2) cluster color, which assigns a unique color to each cluster.
The cells are colored according to % of max (log2(read_count+1)/log2(max(read_count)+1)*100) in five different bins (<1%,<25%,<50%,<75%,≥75%)
- The LEGEND shows RNA expression (nTPM) in each cell type cluster. Hovering over the cluster name reveals nTPM value and number of included cells. Hovering over a bar highlights the corresponding cluster in the UMAP plot above. Color-coding can be toggled on the top of the page, between 2 options: 1) cell type color, which is based on cell type groups used in the Single cell type part of the Single cell resource and 2) cluster color, which assigns a unique color to each cluster.
Cell type color
Cluster color
Colored according to cell type group
Colored according to clusters
Read count filter:0
Cluster filter:
Cluster
Cell type
Expression (nCPM)
c-0
Naive T-cells (CD4+)
c-1
Memory B-cells
c-2
Memory B-cells
c-3
Effector T-cells (CD8+)
c-4
Memory B-cells
c-5
Naive T-cells (CD4+)
c-6
Naive B-cells
c-7
Regulatory T-cells
c-8
Naive T-cells (CD4+)
c-9
Naive T-cells (CD8+)
c-10
Memory B-cells
c-11
Memory B-cells
c-12
Plasma cells (cycling)
c-13
Plasma cells
c-14
Innate lymphoid cells
c-15
Effector T-cells (CD8+)
c-16
Monocytes
c-17
Macrophages
c-18
NKT-cells
c-19
Neutrophils
c-20
NK-cells
c-21
Mast cells
c-22
NK-cells
c-23
Conventional dendritic cell
c-24
Macrophages
c-25
Mixed NKT-cells
c-26
Fibroblasts
c-27
Lymphatic endothelial cells
c-28
Venous endothelial cells
c-29
Conventional dendritic cell
c-30
Lymphoid DC
c-31
Arterial endothelial cells
c-32
Plasmacytoid DCs
SINGLE CELL TYPE TABULA SAPIENS - LYMPH NODEi
RNA expression in the single cell type clusters identified in this tissue visualized by a UMAP plot and a bar chart. This window shows single cell expression data generated by the https://tabula-sapiens.sf.czbiohub.org/about#consortium, that also offers UMAP visualization and cell type clusters for each tissue sample: https://tabula-sapiens.sf.czbiohub.org/organs, here integrate offering easy comparison to the HPA cluster method of single cell types.
UMAP PLOT visualizes the cells in each cluster; where each dot corresponds to a cell. For each individual cell, mouseover reveals read count and which cluster the cell belongs to. Hovering over a cluster name will highlight the corresponding cluster in the bar chart below. There are 2 options for color schemes: 1) cell type color, which is based on cell type groups used in the Single cell type part of the Single cell resource and 2) cluster color, which assigns a unique color to each cluster.
The cells are colored according to % of max (log2(read_count+1)/log2(max(read_count)+1)*100) in five different bins (<1%,<25%,<50%,<75%,≥75%)
The LEGEND shows RNA expression (nTPM) in each cell type cluster. Hovering over the cluster name reveals nTPM value and number of included cells. Hovering over a bar highlights the corresponding cluster in the UMAP plot above. Color-coding can be toggled on the top of the page, between 2 options: 1) cell type color, which is based on cell type groups used in the Single cell type part of the Single cell resource and 2) cluster color, which assigns a unique color to each cluster.
Cell type color
Cluster color
Colored according to cell type group
Colored according to clusters
Read count filter:0
Cluster
Cell type
Expression (nCPM)
c-0
B cell
c-1
Cd8-positive alpha-beta t c
c-2
T cell
c-3
Type i nk t cell
c-4
Cd4-positive alpha-beta t c
c-5
Innate lymphoid cell
c-6
Regulatory t cell
c-7
Plasma cell
c-8
Neutrophil
c-9
Classical monocyte
c-10
Nk cell
c-11
Macrophage
c-12
Endothelial cell
c-13
Cd141-positive myeloid dend...
c-14
Cd1c-positive myeloid dendr...
c-15
Intermediate monocyte
c-16
Hematopoietic stem cell
c-17
Non-classical monocyte
c-18
Mast cell
c-19
Plasmacytoid dendritic cell
c-20
Stromal cell
c-21
Erythrocyte
c-22
Mature conventional dendrit...
c-23
Naive b cell
c-24
Memory b cell
c-25
Naive thymus-derived cd4-po...
c-26
Cd4-positive, alpha-beta me...
c-27
Cd8-positive, alpha-beta me...
c-28
Mature nk t cell
CELL TYPE MARKERSi
The heatmap in this section shows expression of the currently selected gene (on top) and well-known cell type markers in the different single cell type clusters of this tissue. The panel on the left shows which cell type each marker is associated with. Color-coding is based on cell type groups, each consisting of cell types with functional features in common.
Hover the mouse-pointer over the individual data points (squares) to see nTPM level and Z-score. Clicking on a gene name redirects to the corresponding gene page.
Z-score is when you normalize a variable such that the standard deviation is 1 and the mean is 0. Thus, all the genes are easier to compare, as they have the same center and distribution.
SINGLE CELL TYPE
TABULA SAPIENS
Max-norm
Z-score
Fraction of highest expression (≥1 nTPM)
log2(nTPM+1) z-score
Max-norm
Z-score
Fraction of highest expression (≥1 nTPM)
log2(nTPM+1) z-score
DVP - LYMPH NODEi
Relative protein amount measured using Deep Visual Proteomics. Here, on the detail page, all the biological replicates are shown, compared to the median value displayed on the gene summary page. The matched, selected single cell type clusters for the RNA-Protein comparison is also shown. The selected Cell Type clusters have the same name and ID as in the original dataset, above.
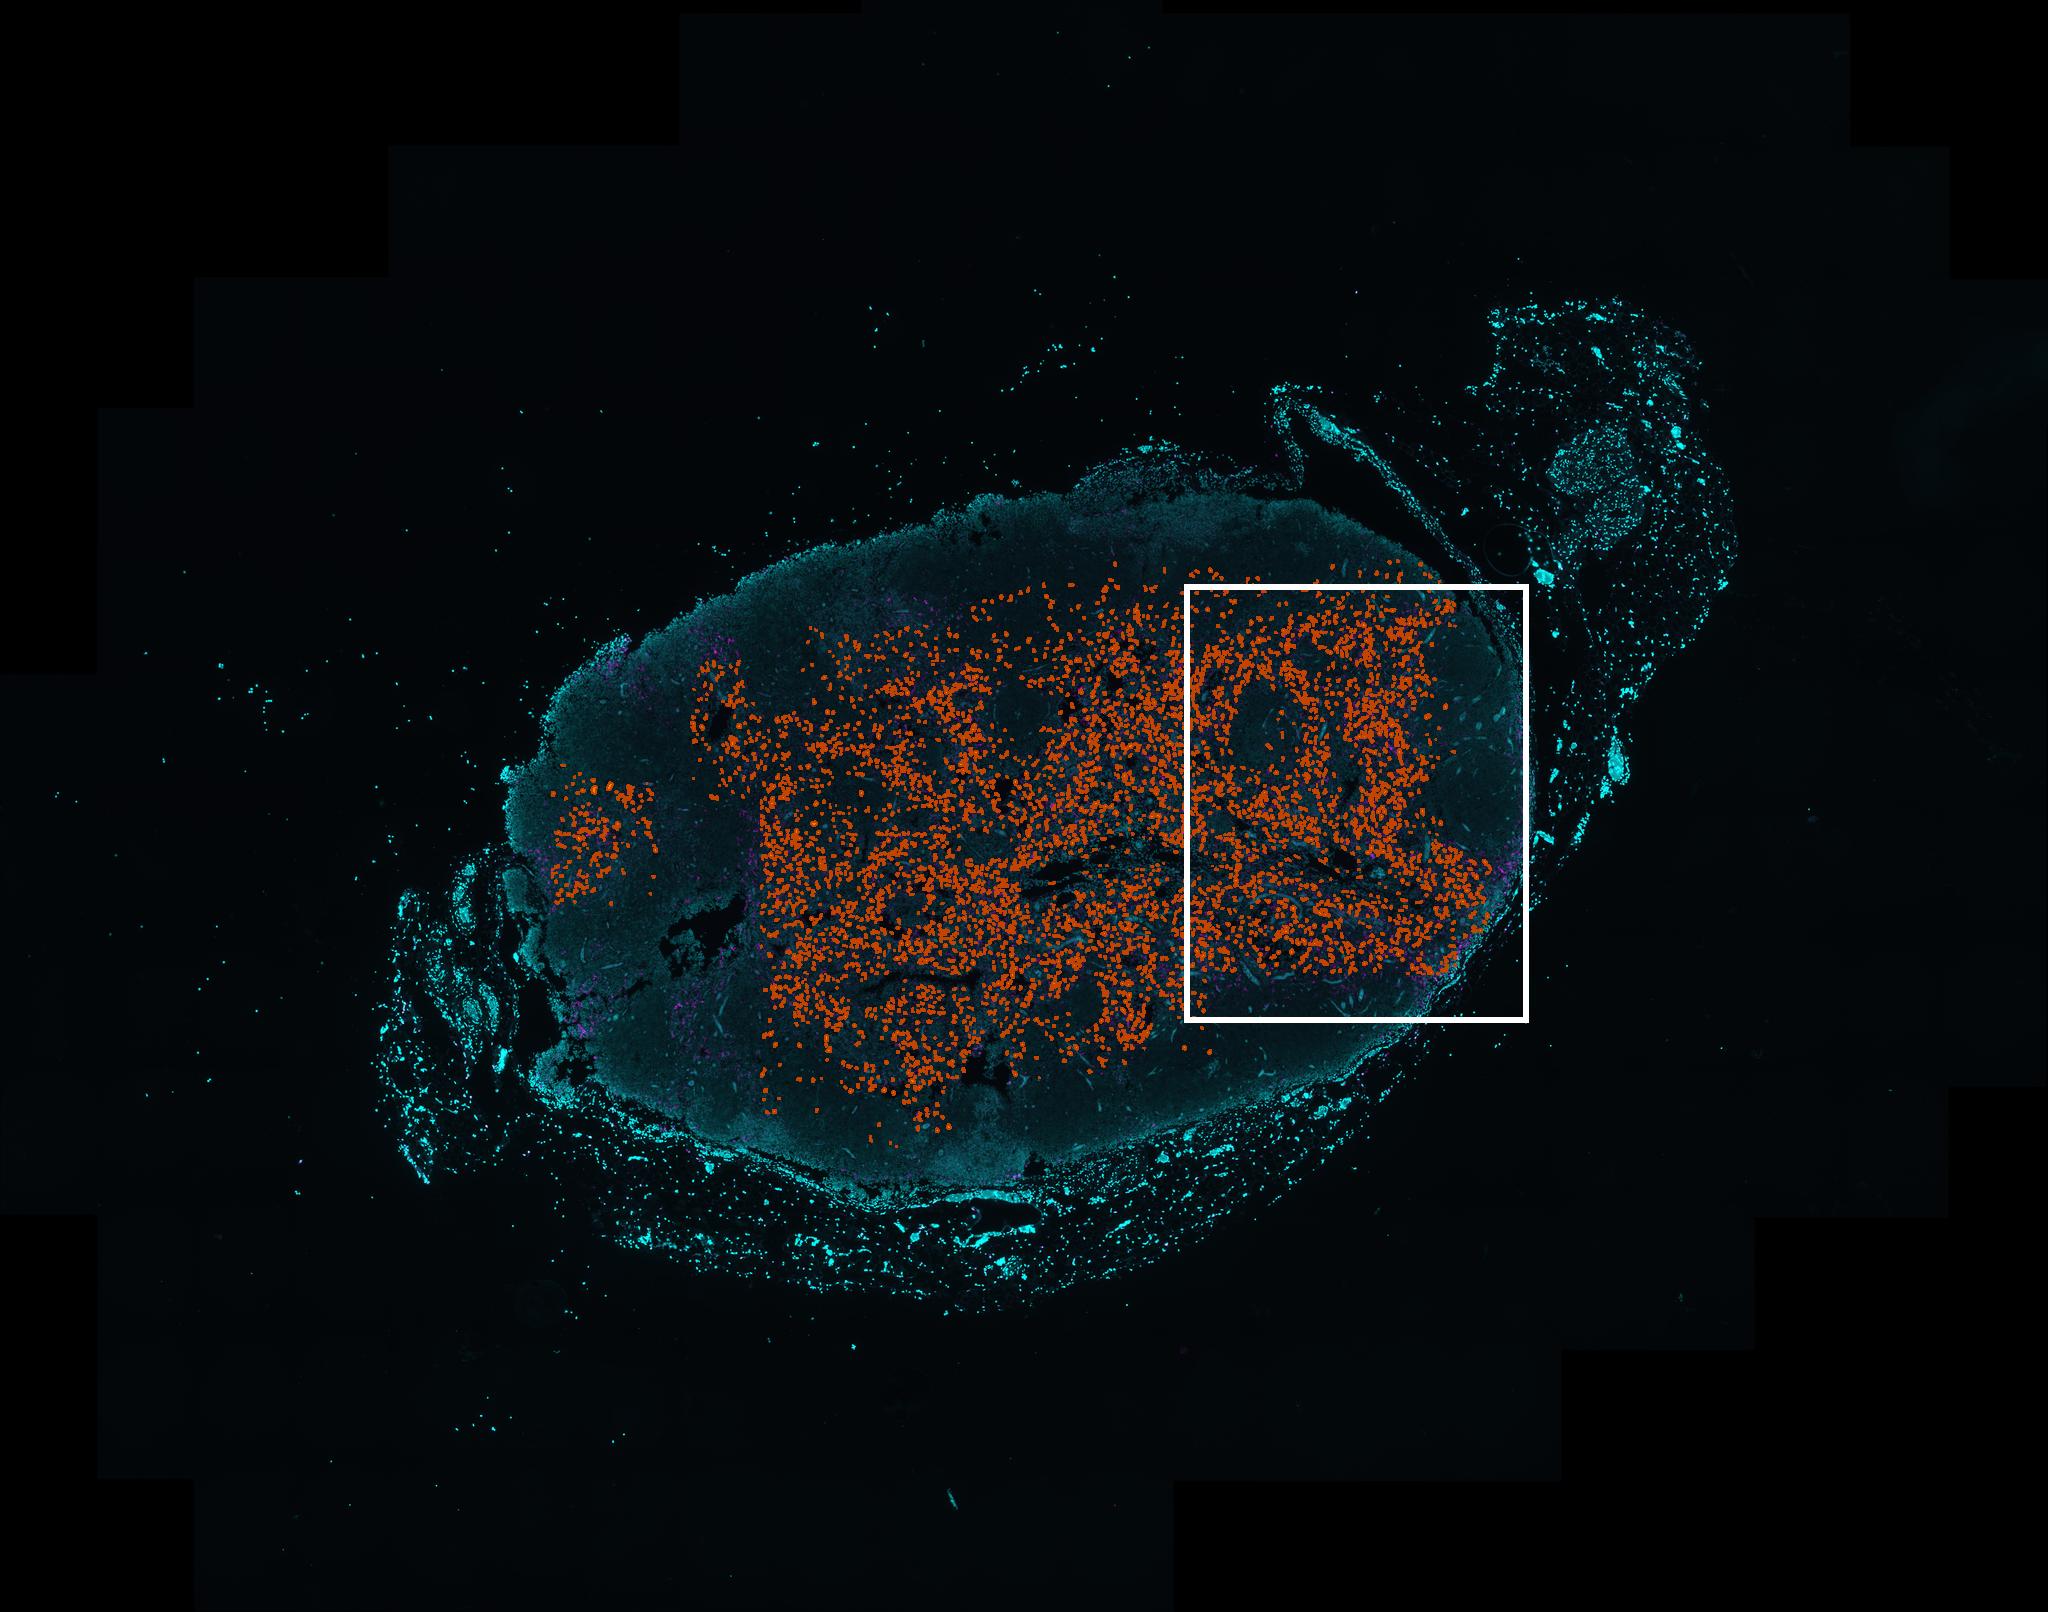
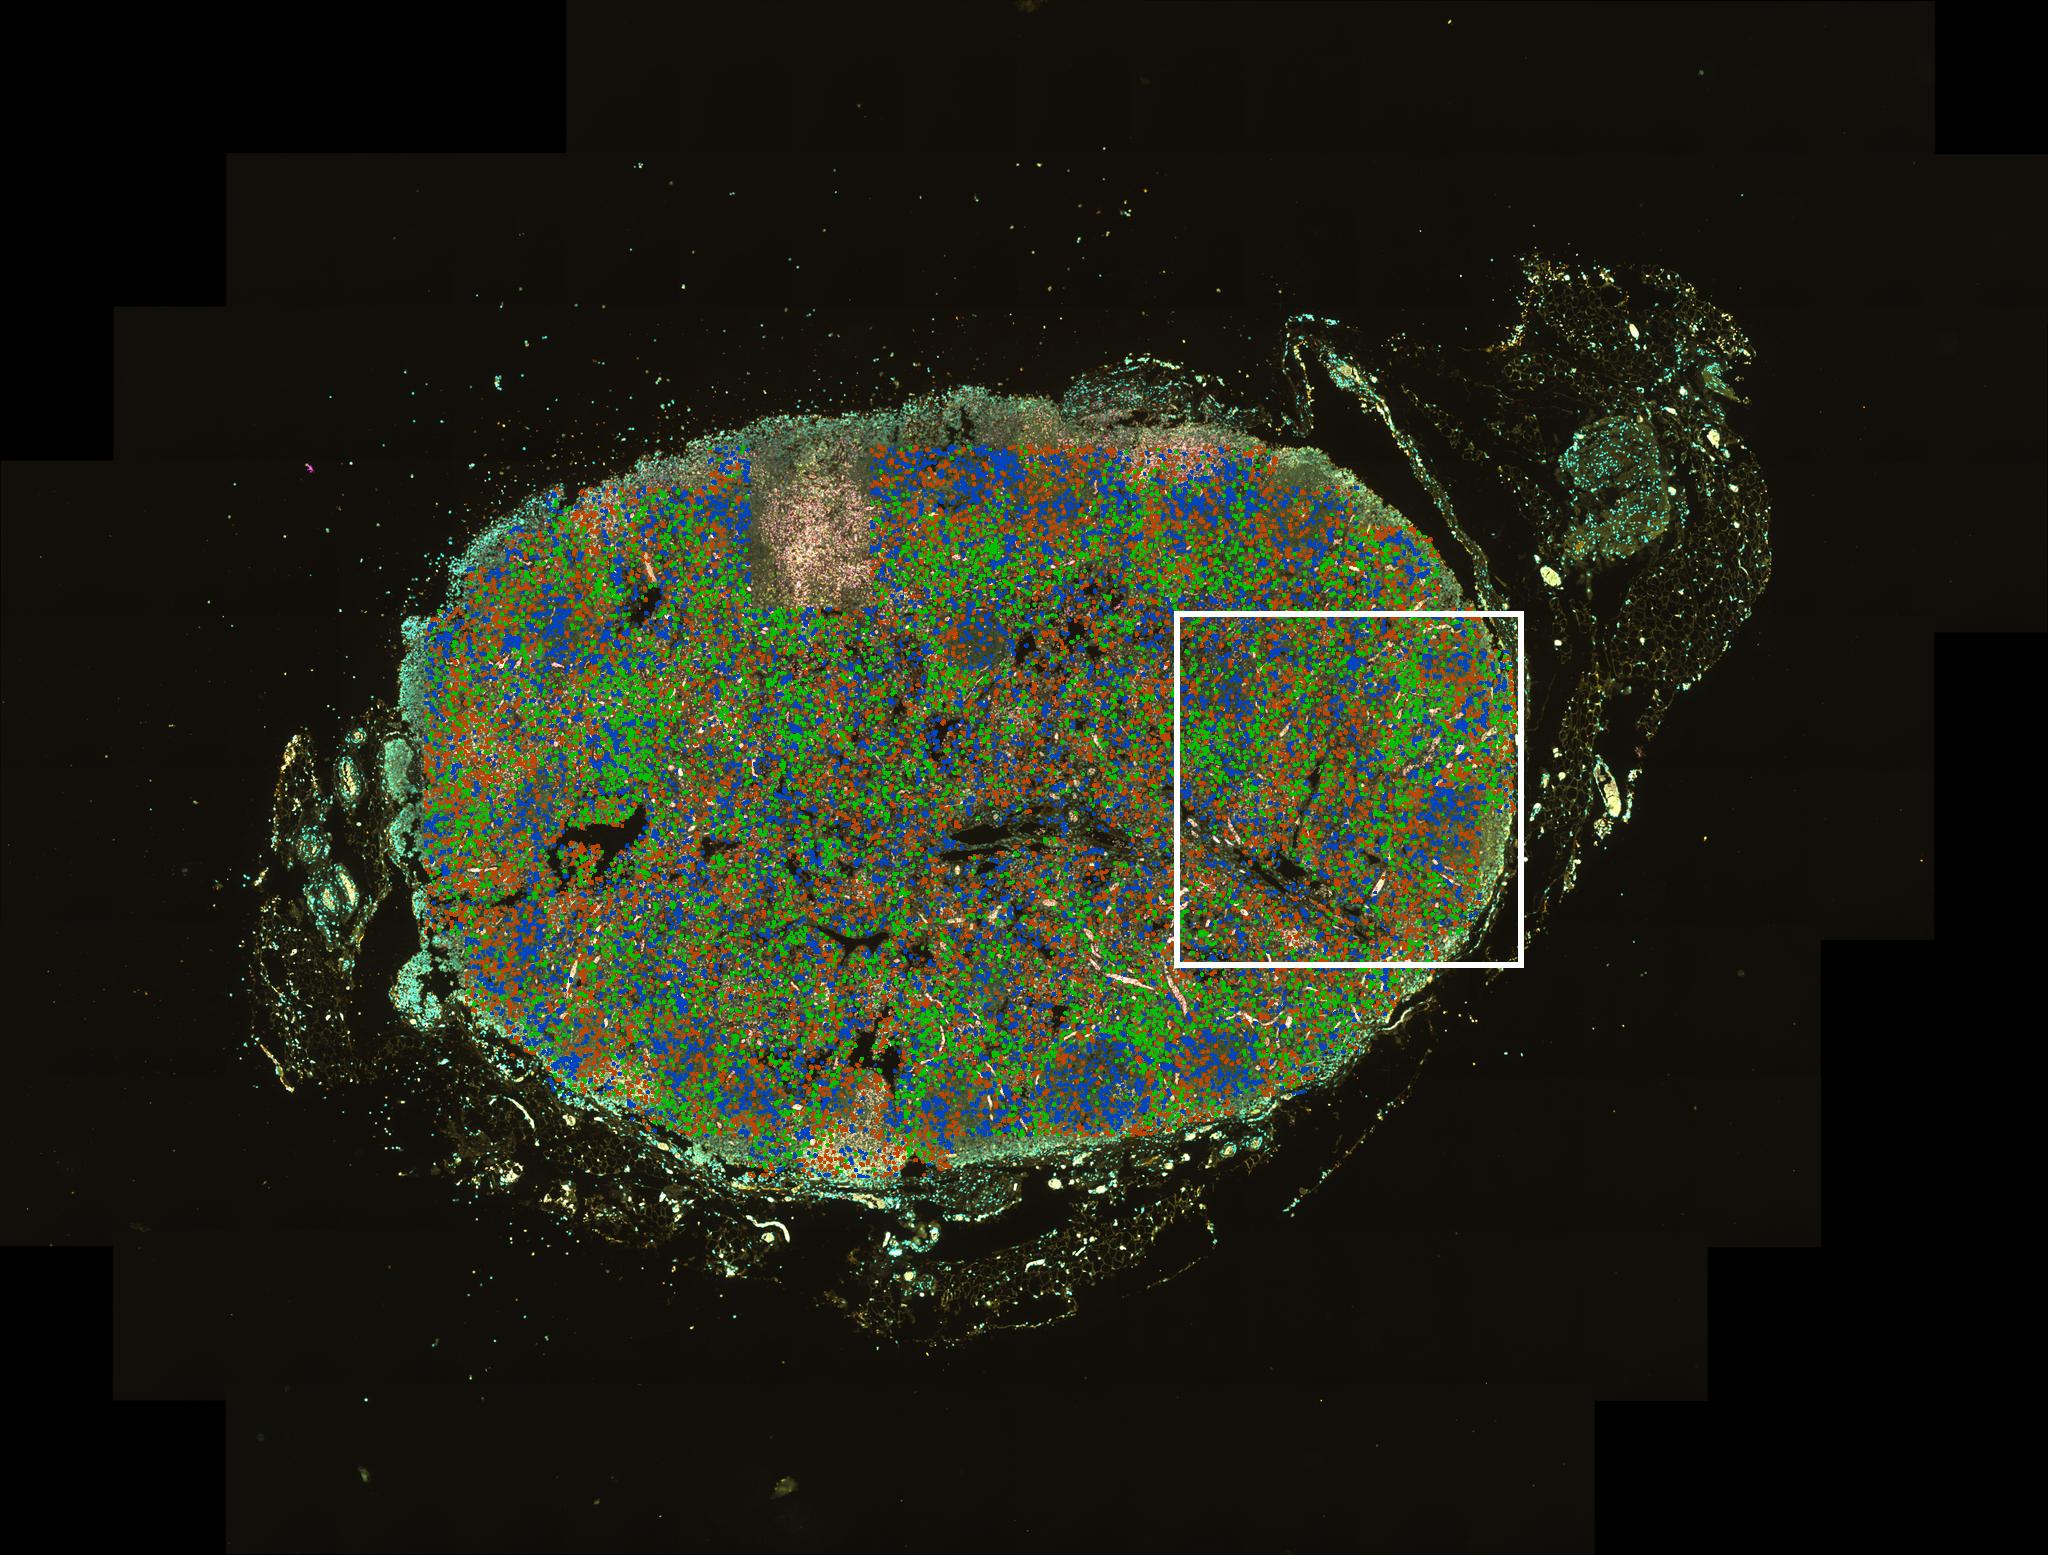
Below, we show a thumbnail overview of the tissue section used for the DVP, as well as smaller cropped area, that is clickable for a high-resolution zoomable image, where you can switch on and off the segmentation mask that was used for sample collection.
Learn more about the DVP method and different markers used the cell types here
Immunofluorescence image with DVP segmentation contours, high resolution cropped area with cell type markers (More info). This is lymph node, and includes CD163 labeling of macrophages.
Cell type
CD4 T-cells
RNA
Cluster
Cell type
Expression (nCPM)
c-0
Naive T-cells (CD4+)
c-5
Naive T-cells (CD4+)
c-8
Naive T-cells (CD4+)
Protein
Sample name
Intensity
CD4 T-cells_01
ND
CD4 T-cells_02
ND
CD4 T-cells_03
ND
CD4 T-cells_04
ND
CD4 T-cells_05
ND
Immunofluorescence image with DVP segmentation contours, high resolution cropped area with cell type markers (More info). This is lymph node, and includes MS4A1 labeling of B-cells as well as labeling of CD4 and CD8 positive T-cells.
Cell type
CD8 T-cells
RNA
Cluster
Cell type
Expression (nCPM)
c-3
Effector T-cells (CD8+)
c-9
Naive T-cells (CD8+)
c-15
Effector T-cells (CD8+)
Protein
Sample name
Intensity
CD8 T-cells_01
ND
CD8 T-cells_02
ND
CD8 T-cells_03
ND
CD8 T-cells_04
ND
CD8 T-cells_05
ND
Immunofluorescence image with DVP segmentation contours, high resolution cropped area with cell type markers (More info). This is lymph node, and includes MS4A1 labeling of B-cells as well as labeling of CD4 and CD8 positive T-cells.
Cell type
B-cells
RNA
Cluster
Cell type
Expression (nCPM)
c-1
Memory B-cells
c-2
Memory B-cells
c-4
Memory B-cells
c-6
Naive B-cells
c-10
Memory B-cells
c-11
Memory B-cells
Protein
Sample name
Intensity
B-cells_01
ND
B-cells_02
ND
B-cells_03
ND
B-cells_04
ND
B-cells_05
ND
Immunofluorescence image with DVP segmentation contours, high resolution cropped area with cell type markers (More info). This is lymph node, and includes MS4A1 labeling of B-cells as well as labeling of CD4 and CD8 positive T-cells.

 The Human Protein Atlas project is funded