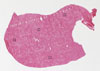
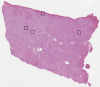
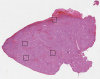
On the top, protein expression in current human tissue, based on all annotated cell types, is reported with the units not detected (n), low (l), medium (m) and high (h). Underneath, protein expression in each annotated cell type are reported using the same units. Protein expression data is based on knowledge-based annotation. For genes where more than one antibody has been used, a collective score is set. If knowledge-based annotation could not be performed for a gene, no data is displayed here. View antibody staining data further down this page.
h
m
l
n
Cholangiocytes:
Not detected
Hepatocytes:
Not detected
RNA expressioni
A summary of mRNA expression data available for current tissue based on several datasets. The mRNA expression levels in human tissues are based on RNA-seq data generated by the Human Protein Atlas HPA, Genotype-Tissue Expression GTEx portal and CAGE data generated by the FANTOM5 consortium. Consensus normalized expression levels for human tissues was created by combining the data from HPA and GTEx datasets. The mRNA expression levels in pig brain are based on RNA-seq data generated by the Human Protein Atlas, and for mouse brain HPA data and in situ hybridization generated by the Allen brain atlas dataset are reported.
Scroll down to view mRNA expression data in more detail.
Antibody staining in the annotated cell types in the current human tissue is reported as not detected, low, medium, or high, based on conventional immunohistochemistry profiling in selected tissues. This score is based on the combination of the staining intensity and fraction of stained cells. Each image is clickable and will lead to virtual microscopy that enables deeper exploration of all samples and also displays staining intensity scores, fraction scores and subcellular localization as well as patient and tissue information for each sample.
Ascending and descending describe two types of gradient, based on difference in staining intensity between enterocytes in crypts and apical enterocytes.
Ascending - the staining intensity is stronger in apical enterocytes (towards the lumen) compared to enterocytes in the crypts (gland based)
Descending - the staining is weaker in apical enterocytes compared to enterocytes in crypts
Antibody HPA001887
Antibody HPA002127
Antibody CAB033631
Antibody CAB072865
Antibody CAB072866
Cholangiocytes
Not detected
Not detected
Not detected
Not detected
Not detected
Hepatocytes
Not detected
Not detected
Not detected
Not detected
Not detected
LIVER - PROTEINTALKS DB MS
Median intensity
19963
Sample
Intensity
Liver_01
21106
Liver_02
5799
Liver_03
21801
Liver_04
19963
Liver_05
22626
Liver_06
20967
Liver_07
5947
Liver_08
4535
Liver_09
4504
Liver_10
ND
LIVER - MANN MS
Median intensity
31234835
Replicate
Intensity
Liver_01
37457631
Liver_02
28190665
Liver_03
31234835
LIVER - HPA RNA-seqi
The RNA-seq details section shows detailed information about the individual samples used for the transcript profiling and results of the RNA-seq analysis.
Information about each individual sample is listed below, including gender, age, a tissue section image and estimated fractions of cell types. nTPM (normalized transcripts per million) values give a quantification of the gene abundance which is comparable between different genes and samples.
Average nTPMi
Max subtype nTPM is the value for the subtype with the largest average nTPM across the subtype samples.
275.2
Female, age 60
Liver sample 21 nTPM: 401.6
Male, age 54
Liver sample 23 nTPM: 475.3
Cell types%
Hepatocytes:
80
Fibroblasts:
15
Other cell types:
5
Male, age 74
Liver sample 24 nTPM: 341.1
Cell types%
Hepatocytes:
85
Fibroblasts:
5
Other cell types:
10
Female, age 62
Liver sample 350 nTPM: 77.4
Cell types%
Hepatocytes:
70
Fibroblasts:
10
Other cell types:
20
Male, age 78
Liver sample 351 nTPM: 81.6
Cell types%
Hepatocytes:
75
Fibroblasts:
5
Other cell types:
20
Male, age 53
Liver sample 352 nTPM: 148
Cell types%
Hepatocytes:
80
Fibroblasts:
5
Other cell types:
15
Male, age 77
Liver sample 353 nTPM: 218.8
Cell types%
Hepatocytes:
75
Fibroblasts:
5
Other cell types:
20
Female, age 72
Liver sample 359 nTPM: 578.1
Cell types%
Hepatocytes:
50
Fibroblasts:
10
Other cell types:
40
Male, age 70
Liver sample 367 nTPM: 196.4
Cell types%
Hepatocytes:
65
Fibroblasts:
10
Other cell types:
25
Female, age 23
Liver sample 396 nTPM: 234.2
Cell types%
Hepatocytes:
70
Fibroblasts:
5
Other cell types:
25
LIVER - GTEx RNA-seqi
RNA-Seq data generated by the Genotype-Tissue Expression (GTEx) project from human tissues is reported as mean nTPM. More information can be found on the GTEx portal.
Distribution across the dataset is visualized with box plots, shown as median and 25th and 75th percentiles. Points are displayed as outliers if they are above or below 1.5 times the interquartile range. nTPM values of the individual samples are presented next to the box plot.
Max subtype nTPMi
Max subtype nTPM is the value for the subtype with the largest average nTPM across the subtype samples.
425.8
GTEx sample id
Sample description
nTPM
Liver Average nTPM: 425.8
Samples: 262
Max nTPM: 1766.3
Min nTPM: 84.6
Std nTPM: 239.4
Median nTPM: 376.1
GTEX-U8XE-1526-SM-4E3HT
30-39 years, male
1766.3
GTEX-1A32A-0826-SM-72D5C
50-59 years, female
1293.3
GTEX-W5X1-0126-SM-HLJRF
40-49 years, female
1285.5
GTEX-1IKK5-0326-SM-C1YPY
60-69 years, male
1260.2
GTEX-1B932-1426-SM-793AN
40-49 years, female
1248.9
GTEX-1CB4F-1726-SM-7MGXH
60-69 years, male
1057.6
GTEX-17EVP-1026-SM-7IGOZ
40-49 years, male
1026.2
GTEX-1GZ4I-1526-SM-9OSW9
50-59 years, male
1014.1
GTEX-UPK5-1426-SM-4JBHH
40-49 years, male
970.8
GTEX-R53T-0326-SM-48FEC
50-59 years, female
968.4
GTEX-15RJ7-2026-SM-6LPJ4
40-49 years, male
947.8
GTEX-WWYW-1026-SM-GQ1CM
50-59 years, female
946.3
GTEX-QXCU-1826-SM-HLJS6
50-59 years, male
902.2
GTEX-Y3IK-0326-SM-HLJRD
50-59 years, female
853.6
GTEX-XXEK-1126-SM-4BRUX
50-59 years, male
824.5
GTEX-12WSD-1426-SM-5GCN9
60-69 years, female
816.7
GTEX-1GN73-1126-SM-9OSW5
60-69 years, male
798.4
GTEX-139TS-1426-SM-5IFJD
60-69 years, male
797.7
GTEX-13SLX-1226-SM-5S2Q6
50-59 years, female
795.7
GTEX-VUSG-0126-SM-4KL1X
50-59 years, male
782.8
GTEX-OHPM-0826-SM-HLJRC
50-59 years, male
771.7
GTEX-Z9EW-0426-SM-5CVM9
40-49 years, male
771.7
GTEX-1212Z-0226-SM-59HLF
60-69 years, male
766.1
GTEX-12KS4-1326-SM-5LUB3
30-39 years, male
759.7
GTEX-WFON-1726-SM-4LVMQ
40-49 years, male
752.3
GTEX-14DAQ-1726-SM-5S2R2
60-69 years, female
743.3
GTEX-1QCLZ-1226-SM-EAZ49
60-69 years, female
737.2
GTEX-18A7A-1526-SM-72D69
50-59 years, female
729.3
GTEX-17HII-1026-SM-7IGLY
50-59 years, male
720.8
GTEX-14753-1626-SM-5NQ9L
60-69 years, male
713.2
GTEX-13FTW-1126-SM-5J2NV
40-49 years, male
698.9
GTEX-YFC4-1526-SM-5IFJS
40-49 years, female
697.3
GTEX-13PVQ-1526-SM-5IFEQ
50-59 years, male
688.9
GTEX-RM2N-1926-SM-48FCU
50-59 years, male
685.1
GTEX-13FLV-0326-SM-5N9DJ
50-59 years, male
667.6
GTEX-TKQ2-1726-SM-4DXUP
50-59 years, male
654.7
GTEX-Y5LM-0426-SM-4VBRO
40-49 years, female
646.2
GTEX-YECK-1926-SM-4W21H
60-69 years, male
644.9
GTEX-1ICLY-1526-SM-C1YS4
50-59 years, male
629.3
GTEX-145MF-0826-SM-5QGQA
50-59 years, male
617.3
GTEX-1B996-1426-SM-7EPIA
60-69 years, male
615.3
GTEX-OXRK-1226-SM-HLJR8
50-59 years, female
611.6
GTEX-13NZB-0626-SM-5IFH6
30-39 years, male
598.2
GTEX-X4EO-1126-SM-4QARQ
60-69 years, female
591.7
GTEX-ZF2S-3026-SM-4WWCH
50-59 years, female
590.4
GTEX-11EMC-0326-SM-HAV2K
60-69 years, female
580.4
GTEX-147JS-1126-SM-5RQIW
60-69 years, male
573.7
GTEX-WYVS-1926-SM-4PQZ2
40-49 years, female
572.9
GTEX-13PVR-0126-SM-5S2PY
60-69 years, female
572.2
GTEX-RTLS-1326-SM-46MUN
60-69 years, female
572.2
GTEX-13NZ9-1326-SM-5MR3V
50-59 years, male
571.3
GTEX-ZPU1-0826-SM-57WG2
40-49 years, male
566.8
GTEX-1399R-1226-SM-5P9GF
30-39 years, male
565.9
GTEX-13O3O-1826-SM-5IFGW
60-69 years, female
564.5
GTEX-1GN2E-0926-SM-9WPOH
60-69 years, male
559.7
GTEX-ZF29-2026-SM-DNZYW
60-69 years, female
557.6
GTEX-147F4-1426-SM-5LUA8
50-59 years, male
556.0
GTEX-ZYT6-0626-SM-5E45V
30-39 years, male
552.9
GTEX-1C6VQ-1626-SM-79OO1
50-59 years, male
550.2
GTEX-17MF6-1126-SM-7DUFS
40-49 years, male
546.7
GTEX-ZZPU-0426-SM-5GZYH
50-59 years, female
546.2
GTEX-11DXZ-0126-SM-5EGGY
50-59 years, male
541.4
GTEX-132NY-0926-SM-5P9G3
60-69 years, male
540.8
GTEX-1J8EW-1626-SM-C1YQ8
60-69 years, female
540.0
GTEX-1IKJJ-1526-SM-C1YSC
60-69 years, male
534.4
GTEX-WY7C-0726-SM-4ONCB
50-59 years, male
534.4
GTEX-RWSA-1426-SM-47JXA
40-49 years, male
533.3
GTEX-14E7W-1526-SM-6871X
70-79 years, male
523.1
GTEX-11TUW-1726-SM-5BC5C
60-69 years, male
522.7
GTEX-17HHE-0126-SM-79398
50-59 years, male
518.9
GTEX-1PPGY-2226-SM-F2I29
60-69 years, male
517.7
GTEX-ZTPG-1426-SM-51MT3
20-29 years, female
509.9
GTEX-145MO-2326-SM-5NQ9K
60-69 years, male
504.1
GTEX-1B8SG-1326-SM-79ONT
50-59 years, male
502.2
GTEX-18465-1626-SM-7LG6N
50-59 years, male
501.2
GTEX-12696-0826-SM-5EGGE
60-69 years, male
499.0
GTEX-1HBPI-1026-SM-AHZ4N
50-59 years, male
495.3
GTEX-ZEX8-0826-SM-4WKHK
50-59 years, male
493.8
GTEX-1KD5A-1226-SM-CXZK7
50-59 years, male
493.7
GTEX-1HB9E-0626-SM-AHZ4K
50-59 years, male
485.0
GTEX-P78B-1326-SM-3P611
40-49 years, female
482.3
GTEX-131XE-0326-SM-5LZVO
50-59 years, male
479.5
GTEX-YEC4-0826-SM-5P9FV
40-49 years, male
478.7
GTEX-QV44-0326-SM-C1YQX
50-59 years, male
475.7
GTEX-RU72-1426-SM-46MUF
50-59 years, female
472.9
GTEX-ZAB5-0426-SM-5CVMI
50-59 years, male
472.6
GTEX-1AMFI-0826-SM-731DV
50-59 years, female
471.8
GTEX-1IDJH-1526-SM-GA8ZW
70-79 years, male
470.7
GTEX-WQUQ-1926-SM-4M9QM
60-69 years, male
469.3
GTEX-1S3DN-1126-SM-HLJQO
50-59 years, male
461.4
GTEX-ZVT4-0626-SM-5E45T
50-59 years, female
460.0
GTEX-O5YW-0826-SM-HK7A3
50-59 years, male
457.7
GTEX-1JJEA-1526-SM-CNNPK
60-69 years, male
456.5
GTEX-1ICG6-1026-SM-B2LY6
70-79 years, female
453.1
GTEX-1CAMQ-1426-SM-7MKFL
40-49 years, male
451.4
GTEX-14E1K-0326-SM-5S2PE
50-59 years, male
448.1
GTEX-Q734-0326-SM-48U15
40-49 years, female
447.8
GTEX-146FH-1526-SM-5NQBU
50-59 years, female
444.7
GTEX-13OW6-2626-SM-5IFF2
50-59 years, male
440.6
GTEX-1HBPH-2626-SM-A96TV
40-49 years, female
438.4
GTEX-QEG4-1826-SM-CKZN9
30-39 years, male
436.3
GTEX-1H11D-0826-SM-9OSWB
40-49 years, male
435.1
GTEX-QDVN-0826-SM-48TZ2
50-59 years, male
434.5
GTEX-1QP66-0226-SM-DPRXS
50-59 years, male
432.0
GTEX-139YR-0226-SM-5IFEM
50-59 years, male
431.4
GTEX-1R9JW-0826-SM-DPRZJ
30-39 years, female
431.0
GTEX-S33H-1626-SM-4AD68
30-39 years, male
430.2
GTEX-SJXC-1226-SM-4DM78
60-69 years, male
429.4
GTEX-1HCU6-2026-SM-GA91U
60-69 years, female
427.9
GTEX-145LU-1326-SM-5LU9N
50-59 years, male
422.9
GTEX-14JG1-1626-SM-664NH
40-49 years, male
422.7
GTEX-WL46-1726-SM-HAUZC
50-59 years, male
422.7
GTEX-14PHX-0526-SM-664NW
50-59 years, male
419.0
GTEX-S4Z8-0526-SM-4AD4T
60-69 years, male
412.4
GTEX-18A66-2026-SM-7189C
60-69 years, male
410.7
GTEX-1BAJH-1526-SM-7RHGI
70-79 years, male
409.5
GTEX-1KANB-2226-SM-DHXJW
50-59 years, male
404.3
GTEX-15DYW-1326-SM-6LPIV
60-69 years, female
403.4
GTEX-ZVP2-0626-SM-51MSO
50-59 years, male
401.5
GTEX-1EN7A-2026-SM-7MGY4
40-49 years, male
399.7
GTEX-1GF9X-0426-SM-7MKHN
40-49 years, female
397.3
GTEX-PX3G-0826-SM-48TZS
20-29 years, female
395.8
GTEX-1JMLX-1326-SM-CXZJO
50-59 years, male
395.4
GTEX-15RJE-1126-SM-6LPI5
40-49 years, male
386.1
GTEX-11EQ9-0526-SM-5A5JZ
30-39 years, male
385.5
GTEX-11GSP-0626-SM-5986T
60-69 years, female
382.9
GTEX-1LSNL-2026-SM-HLJQ4
50-59 years, male
382.3
GTEX-14AS3-0126-SM-5Q5F4
40-49 years, female
380.4
GTEX-13G51-0626-SM-HK7AV
60-69 years, male
378.2
GTEX-1LH75-0926-SM-EAZ5C
50-59 years, female
377.0
GTEX-QESD-2026-SM-447BI
20-29 years, male
377.0
GTEX-14BIL-1326-SM-5O9CZ
50-59 years, male
375.3
GTEX-XPVG-1126-SM-HLJRE
50-59 years, male
374.0
GTEX-SIU8-1226-SM-HLJRG
50-59 years, male
372.0
GTEX-1EKGG-1226-SM-7IGNO
60-69 years, male
369.4
GTEX-1K9T9-0726-SM-CXZJZ
50-59 years, female
368.7
GTEX-1MJIX-0726-SM-DPRYP
40-49 years, male
368.0
GTEX-16MT8-2126-SM-HAV1Q
60-69 years, female
367.9
GTEX-13QJC-0726-SM-5RQJK
60-69 years, female
362.6
GTEX-1PBJJ-0626-SM-DPRYO
30-39 years, male
362.3
GTEX-WVLH-2126-SM-EYYWD
50-59 years, male
357.6
GTEX-11WQC-0726-SM-5EQMR
60-69 years, male
356.1
GTEX-18A6Q-2026-SM-718AQ
60-69 years, male
355.8
GTEX-13N11-0926-SM-5IJG2
50-59 years, female
355.0
GTEX-14C38-1526-SM-5RQJ7
50-59 years, male
354.7
GTEX-1269C-0626-SM-5FQSS
60-69 years, female
350.7
GTEX-U3ZN-0226-SM-3DB8D
30-39 years, female
348.2
GTEX-1KAFJ-0726-SM-CXZKF
50-59 years, male
346.0
GTEX-1AX8Z-1026-SM-7189R
60-69 years, male
344.0
GTEX-Y5V5-0926-SM-4VBPZ
60-69 years, female
341.4
GTEX-1R9PM-0526-SM-F2I1T
20-29 years, male
340.2
GTEX-OOBJ-0826-SM-3NB2K
60-69 years, male
340.1
GTEX-13OVL-0726-SM-HAV29
50-59 years, male
340.0
GTEX-YB5E-0326-SM-5IFHU
40-49 years, male
339.4
GTEX-1GF9V-1226-SM-7MKGY
60-69 years, male
338.7
GTEX-X3Y1-2726-SM-4PQZH
40-49 years, male
335.2
GTEX-1B8L1-0726-SM-7P8RT
60-69 years, male
334.1
GTEX-131YS-1626-SM-5HL6C
60-69 years, female
333.6
GTEX-1QP6S-1326-SM-DPRZ8
40-49 years, male
333.2
GTEX-15UF7-0426-SM-HAV2G
40-49 years, male
330.9
GTEX-1HT8W-0826-SM-C1YRJ
30-39 years, male
329.1
GTEX-11ZTS-1426-SM-5EQMM
60-69 years, female
327.5
GTEX-1OJC4-1126-SM-HLJQI
50-59 years, female
322.3
GTEX-1A8G7-1126-SM-731ED
60-69 years, male
322.1
GTEX-1RQED-0726-SM-HLJQL
60-69 years, male
320.6
GTEX-14A6H-0726-SM-HAV28
30-39 years, male
319.9
GTEX-1JJ6O-0826-SM-CXZJL
60-69 years, male
317.8
GTEX-OIZF-0826-SM-7MKH9
60-69 years, male
317.7
GTEX-11ZUS-2526-SM-59872
30-39 years, male
317.5
GTEX-1QPFJ-1126-SM-E9U5V
30-39 years, female
313.8
GTEX-ZYY3-0626-SM-5NQ6W
60-69 years, female
312.8
GTEX-11ZVC-0726-SM-5FQT9
50-59 years, female
310.3
GTEX-1KWVE-0326-SM-EV7AF
30-39 years, male
309.2
GTEX-148VI-0626-SM-5TDDH
60-69 years, female
308.7
GTEX-1NV8Z-1626-SM-DPRYT
60-69 years, male
306.3
GTEX-1GN1U-0926-SM-9WPPY
50-59 years, female
302.2
GTEX-REY6-1226-SM-48FDR
60-69 years, male
297.3
GTEX-13O1R-2026-SM-5KM3N
60-69 years, male
297.0
GTEX-1E2YA-1226-SM-7MGY3
50-59 years, male
295.1
GTEX-1AX9I-1626-SM-72D5D
60-69 years, male
294.6
GTEX-14XAO-0226-SM-68728
60-69 years, female
293.9
GTEX-14A5I-1726-SM-5QGQ5
50-59 years, female
291.5
GTEX-144GM-1326-SM-5LU5E
20-29 years, male
287.9
GTEX-1GF9W-0826-SM-7MKHI
60-69 years, male
283.7
GTEX-1KD4Q-1526-SM-D4P3L
40-49 years, male
282.0
GTEX-1HCVE-1526-SM-B2LWW
50-59 years, male
280.5
GTEX-1LGRB-0626-SM-CNNQH
50-59 years, female
280.3
GTEX-1I1HK-1126-SM-AHZ2L
60-69 years, male
278.3
GTEX-16Z82-1426-SM-HAV2I
60-69 years, male
275.9
GTEX-13OVJ-1026-SM-5IFGI
50-59 years, female
274.1
GTEX-1H1CY-1026-SM-HLJS4
60-69 years, female
274.1
GTEX-1H1DF-1326-SM-9WPPR
40-49 years, female
273.0
GTEX-139TU-0826-SM-5IJFG
60-69 years, male
271.9
GTEX-X4EP-1026-SM-4QAS5
60-69 years, female
270.6
GTEX-1A8FM-1226-SM-7IGMD
50-59 years, female
268.8
GTEX-WZTO-0626-SM-4PQYY
40-49 years, male
262.0
GTEX-13VXU-0926-SM-5IFFH
50-59 years, male
261.9
GTEX-13112-1426-SM-5EGH8
50-59 years, male
260.7
GTEX-12WSM-0726-SM-5GCOW
60-69 years, male
259.0
GTEX-T6MN-1226-SM-3NMA5
50-59 years, male
258.3
GTEX-1EH9U-1126-SM-7IGLU
60-69 years, male
255.0
GTEX-12WSG-0626-SM-5FQTQ
50-59 years, female
254.7
GTEX-144GL-1426-SM-5O9BO
50-59 years, male
247.8
GTEX-11NUK-1226-SM-5P9GM
50-59 years, male
246.3
GTEX-1399T-0826-SM-5IFES
60-69 years, male
246.3
GTEX-11DXY-0526-SM-5EGGQ
60-69 years, male
243.6
GTEX-11NV4-1326-SM-5HL6V
60-69 years, male
242.2
GTEX-S32W-1926-SM-4AD63
50-59 years, female
241.1
GTEX-1HCU7-1726-SM-B2LX9
50-59 years, male
238.9
GTEX-17F96-1226-SM-79OK2
70-79 years, male
236.6
GTEX-1H23P-1826-SM-GA91S
60-69 years, male
235.9
GTEX-O5YT-0826-SM-3TW8N
20-29 years, male
234.1
GTEX-18D9B-1526-SM-7KFRK
60-69 years, male
231.6
GTEX-15ER7-1826-SM-6LLI7
20-29 years, female
229.7
GTEX-13N2G-0926-SM-5IFGJ
60-69 years, male
222.7
GTEX-13FTZ-0726-SM-5IFFY
60-69 years, male
222.2
GTEX-12WSL-0226-SM-5CVMJ
50-59 years, male
221.2
GTEX-QEL4-1226-SM-447A4
50-59 years, male
209.7
GTEX-S7SE-1326-SM-HLJRN
50-59 years, male
209.2
GTEX-RN64-1826-SM-48FDV
50-59 years, male
205.8
GTEX-131XH-0626-SM-5LZWH
50-59 years, male
202.8
GTEX-UTHO-2426-SM-4JBHD
60-69 years, male
201.2
GTEX-XBEC-1526-SM-4AT68
50-59 years, male
199.7
GTEX-1CB4J-0726-SM-7IGN8
60-69 years, male
199.5
GTEX-17HGU-1826-SM-7IGQM
50-59 years, male
198.2
GTEX-N7MS-1825-SM-HLJR9
60-69 years, male
197.9
GTEX-RNOR-1426-SM-48FDJ
50-59 years, female
197.7
GTEX-1I1GV-1026-SM-GA8Z8
60-69 years, male
197.3
GTEX-1EWIQ-0726-SM-7MKFW
70-79 years, female
194.9
GTEX-1B933-1226-SM-731DW
50-59 years, female
194.7
GTEX-13NYB-1026-SM-5IFH3
40-49 years, male
190.2
GTEX-147GR-1326-SM-7IGLB
60-69 years, male
190.2
GTEX-12WSI-0226-SM-5GCNA
50-59 years, male
182.4
GTEX-ZAB4-0826-SM-5LU9D
40-49 years, male
182.4
GTEX-X4XY-1626-SM-46MVN
60-69 years, male
181.4
GTEX-11OF3-0726-SM-5BC4Z
60-69 years, male
181.3
GTEX-O5YV-0726-SM-EV798
60-69 years, female
177.0
GTEX-Q2AG-1126-SM-48U1P
40-49 years, female
175.8
GTEX-1F75A-1626-SM-9JGGT
50-59 years, male
174.7
GTEX-111FC-1226-SM-HAV27
60-69 years, male
174.3
GTEX-13S7M-1126-SM-HAV2A
60-69 years, female
170.5
GTEX-15CHQ-0926-SM-HAV1W
60-69 years, male
168.7
GTEX-1PIIG-1326-SM-EXOIR
30-39 years, male
164.7
GTEX-ZVT3-1626-SM-5GU66
60-69 years, female
160.2
GTEX-1I1GR-1526-SM-CNNQE
60-69 years, male
158.4
GTEX-Y111-0726-SM-EYYVM
50-59 years, male
157.2
GTEX-1S5VW-1826-SM-EAZ53
60-69 years, male
155.0
GTEX-15SHU-1826-SM-7KUKS
40-49 years, female
152.4
GTEX-132AR-0426-SM-5IFH8
50-59 years, female
151.4
GTEX-11TT1-1726-SM-5EQLJ
20-29 years, male
148.7
GTEX-X261-1726-SM-4PQYT
50-59 years, male
143.7
GTEX-1RQEC-1126-SM-EAZ5E
60-69 years, male
138.6
GTEX-1497J-0726-SM-5Q5D1
60-69 years, male
130.9
GTEX-13113-1326-SM-5GCOI
60-69 years, female
130.3
GTEX-15SZO-1226-SM-6LPIP
50-59 years, male
128.1
GTEX-16YQH-1126-SM-HAV2D
30-39 years, male
128.1
GTEX-1J1OQ-0826-SM-CXZJG
40-49 years, female
128.0
GTEX-1LB8K-1926-SM-HLJQQ
50-59 years, male
124.7
GTEX-12ZZZ-1326-SM-59HKW
60-69 years, male
107.2
GTEX-13X6J-1826-SM-5TDCT
50-59 years, male
104.1
GTEX-14PJO-1726-SM-68719
60-69 years, male
88.7
GTEX-WK11-1326-SM-4M9QU
50-59 years, male
84.6
Show allShow less
LIVER - FANTOM5 CAGEi
RNA expression in human tissues obtained through Cap Analysis of Gene Expression (CAGE) generated by the FANTOM5 project are reported as Scaled Tags Per Million.
Max subtype Scaled Tags Per Millioni
Max subtype Scaled Tags Per Million is the value for the subtype with the largest average Scaled Tags Per Million across the subtype samples.
Max subtype nTPM is the value for the subtype with the largest average nTPM across the subtype samples.
159.5
Macaque sample
Sample description
nTPM
Liver nTPM: 159.5
Samples: 3
Max nTPM: 192.8
Min nTPM: 133.0
Sample B
192.8
Sample C
152.7
Sample D
133.0
LIVER - Pig RNA-seqi
RNA-seq data obtained from pig brain is reported as nTPM. Normal distribution across the dataset is visualized with box plots, shown as median and 25th and 75th percentiles. Points are displayed as outliers if they are above or below 1.5 times the interquartile range. nTPM values of the individual samples are presented next to the box plot.
Max subtype nTPMi
Max subtype nTPM is the value for the subtype with the largest average nTPM across the subtype samples.
156.7
Pig sample
Sample description
nTPM
Liver nTPM: 156.7
Samples: 4
Max nTPM: 215.2
Min nTPM: 116.0
Sample A
Female
215.2
Sample B
Female
116.0
Sample C
Male
123.2
Sample D
Male
172.3
We use cookies to enhance the usability of our website. If you continue, we'll assume that you are happy to receive all cookies. More information. Don't show this again.


 The Human Protein Atlas project is funded