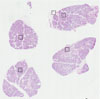
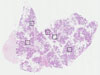
On the top, protein expression in current human tissue, based on all annotated cell types, is reported with the units not detected (n), low (l), medium (m) and high (h). Underneath, protein expression in each annotated cell type are reported using the same units. Protein expression data is based on knowledge-based annotation. For genes where more than one antibody has been used, a collective score is set. If knowledge-based annotation could not be performed for a gene, no data is displayed here. View antibody staining data further down this page.
h
m
l
n
Glandular cells:
Medium
RNA expressioni
A summary of mRNA expression data available for current tissue based on several datasets. The mRNA expression levels in human tissues are based on RNA-seq data generated by the Human Protein Atlas HPA, Genotype-Tissue Expression GTEx portal and CAGE data generated by the FANTOM5 consortium. Consensus normalized expression levels for human tissues was created by combining the data from HPA and GTEx datasets. The mRNA expression levels in pig brain are based on RNA-seq data generated by the Human Protein Atlas, and for mouse brain HPA data and in situ hybridization generated by the Allen brain atlas dataset are reported.
Scroll down to view mRNA expression data in more detail.
Antibody staining in the annotated cell types in the current human tissue is reported as not detected, low, medium, or high, based on conventional immunohistochemistry profiling in selected tissues. This score is based on the combination of the staining intensity and fraction of stained cells. Each image is clickable and will lead to virtual microscopy that enables deeper exploration of all samples and also displays staining intensity scores, fraction scores and subcellular localization as well as patient and tissue information for each sample.
Ascending and descending describe two types of gradient, based on difference in staining intensity between enterocytes in crypts and apical enterocytes.
Ascending - the staining intensity is stronger in apical enterocytes (towards the lumen) compared to enterocytes in the crypts (gland based)
Descending - the staining is weaker in apical enterocytes compared to enterocytes in crypts
Antibody HPA072281
Glandular cells
Medium
SALIVARY GLAND - PROTEINTALKS DB MS
Median intensity
10219
Sample
Intensity
Salivary gland_01
10219
Salivary gland_02
6693
Salivary gland_03
8298
Salivary gland_04
14877
Salivary gland_05
11119
SALIVARY GLAND - MANN MS
Median intensity
2025460
Replicate
Intensity
Salivary gland_01
2113072
Salivary gland_02
2025459
Salivary gland_03
1659413
SALIVARY GLAND - HPA RNA-seqi
The RNA-seq details section shows detailed information about the individual samples used for the transcript profiling and results of the RNA-seq analysis.
Information about each individual sample is listed below, including gender, age, a tissue section image and estimated fractions of cell types. nTPM (normalized transcripts per million) values give a quantification of the gene abundance which is comparable between different genes and samples.
Average nTPMi
Max subtype nTPM is the value for the subtype with the largest average nTPM across the subtype samples.
15.9
Female, age 68
Salivary gland sample 216 nTPM: 17.7
Cell types%
Glandular cells:
45
Ductal cells:
25
Adipocytes:
5
Other cell types:
25
Male, age 60
Salivary gland sample 217 nTPM: 13.4
Cell types%
Glandular cells:
55
Ductal cells:
20
Adipocytes:
5
Endothelial cells:
5
Other cell types:
15
Female, age 21
Salivary gland sample 218 nTPM: 16.6
Cell types%
Glandular cells:
55
Ductal cells:
15
Adipocytes:
5
Endothelial cells:
5
Other cell types:
20
SALIVARY GLAND - GTEx RNA-seqi
RNA-Seq data generated by the Genotype-Tissue Expression (GTEx) project from human tissues is reported as mean nTPM. More information can be found on the GTEx portal.
Distribution across the dataset is visualized with box plots, shown as median and 25th and 75th percentiles. Points are displayed as outliers if they are above or below 1.5 times the interquartile range. nTPM values of the individual samples are presented next to the box plot.
Max subtype nTPMi
Max subtype nTPM is the value for the subtype with the largest average nTPM across the subtype samples.
34.8
GTEx sample id
Sample description
nTPM
Minor Salivary Gland Average nTPM: 34.8
Samples: 181
Max nTPM: 60.7
Min nTPM: 11.6
Std nTPM: 6.8
Median nTPM: 34.7
GTEX-ZAB5-2326-SM-5IJFR
50-59 years, male
60.7
GTEX-1O97I-2826-SM-HPAEO
60-69 years, male
55.3
GTEX-12BJ1-2226-SM-5BC6G
60-69 years, male
51.3
GTEX-Y5LM-1826-SM-4VDT9
40-49 years, female
51.1
GTEX-1CB4I-2526-SM-7MKG1
50-59 years, male
48.3
GTEX-1192X-2926-SM-5N9BA
50-59 years, male
47.7
GTEX-11EMC-2526-SM-5PNVU
60-69 years, female
47.5
GTEX-ZT9W-2126-SM-51MSF
50-59 years, male
47.3
GTEX-11NV4-1926-SM-5N9D4
60-69 years, male
46.8
GTEX-18A67-0626-SM-7KFSL
50-59 years, male
46.2
GTEX-ZLFU-2226-SM-EXUS7
40-49 years, male
46.2
GTEX-1GPI7-0326-SM-7MKH6
20-29 years, male
45.9
GTEX-YJ8A-1826-SM-GNTAB
20-29 years, male
45.7
GTEX-11TUW-2426-SM-5EQKB
60-69 years, male
44.6
GTEX-1LSNL-2626-SM-EV7AT
50-59 years, male
43.8
GTEX-1J1R8-1826-SM-AHZ3B
40-49 years, male
43.4
GTEX-1A3MV-1726-SM-72D68
30-39 years, male
43.1
GTEX-ZLWG-2026-SM-DO11F
50-59 years, female
43.1
GTEX-1KD4Q-2526-SM-CXZKL
40-49 years, male
43.0
GTEX-11ZTS-3026-SM-5EQM7
60-69 years, female
42.6
GTEX-ZPU1-2326-SM-57WEP
40-49 years, male
42.5
GTEX-15CHC-1226-SM-686ZH
60-69 years, female
42.1
GTEX-1HR9M-2526-SM-A9G3J
60-69 years, male
42.0
GTEX-131XH-2626-SM-5GCNP
50-59 years, male
41.9
GTEX-11WQK-2926-SM-5EQKT
50-59 years, male
41.8
GTEX-1JKYR-0726-SM-AHZ3K
20-29 years, male
41.7
GTEX-1S5VW-1026-SM-HK797
60-69 years, male
41.7
GTEX-1GF9X-0226-SM-7P8SM
40-49 years, female
41.2
GTEX-1ICLY-0626-SM-GA915
50-59 years, male
41.1
GTEX-1PDJ9-2126-SM-HPAFH
20-29 years, male
41.1
GTEX-1H4P4-2026-SM-9WPNV
50-59 years, male
40.8
GTEX-13OVK-1826-SM-6PALE
40-49 years, male
40.7
GTEX-1JN1M-2426-SM-ARU93
60-69 years, female
40.5
GTEX-1PPH8-1526-SM-E6CQO
20-29 years, male
40.5
GTEX-ZP4G-1926-SM-57WDZ
20-29 years, female
40.3
GTEX-1NHNU-2226-SM-GRR2I
50-59 years, male
40.0
GTEX-1R9K5-0626-SM-DPRZB
50-59 years, male
40.0
GTEX-1C64O-0626-SM-7DHL1
60-69 years, male
39.9
GTEX-1OJC3-1026-SM-E6CQK
20-29 years, male
39.8
GTEX-1PIEJ-0626-SM-DTX99
20-29 years, female
39.8
GTEX-12WSM-1826-SM-5BC64
60-69 years, male
39.3
GTEX-13OVL-2926-SM-5IFG3
50-59 years, male
39.3
GTEX-14E1K-2626-SM-664OJ
50-59 years, male
39.3
GTEX-1IDJD-2526-SM-C1YSA
30-39 years, male
39.3
GTEX-17MFQ-1626-SM-7938Z
20-29 years, male
39.2
GTEX-1HSMP-1926-SM-GA8Z5
70-79 years, male
39.2
GTEX-ZF29-2126-SM-DNZYX
60-69 years, female
39.2
GTEX-1C4CL-2026-SM-731EB
30-39 years, male
38.9
GTEX-1C6VR-0726-SM-7P8OV
60-69 years, male
38.9
GTEX-1JN6P-2526-SM-CNNPX
60-69 years, male
38.7
GTEX-1POEN-2226-SM-DPRXV
30-39 years, female
38.6
GTEX-YB5K-1726-SM-5IFIZ
40-49 years, female
38.6
GTEX-12WSL-2126-SM-5GCNG
50-59 years, male
38.4
GTEX-14PJ3-1526-SM-664O9
50-59 years, male
38.4
GTEX-WFJO-2026-SM-4LVM3
30-39 years, male
38.3
GTEX-ZXG5-2826-SM-5NQ8T
60-69 years, male
38.3
GTEX-1HSEH-1826-SM-A96SA
60-69 years, male
38.2
GTEX-18QFQ-0626-SM-718AW
30-39 years, male
38.0
GTEX-1MCQQ-2226-SM-DLHC4
60-69 years, male
38.0
GTEX-WY7C-1426-SM-4OND1
50-59 years, male
37.9
GTEX-14B4R-1426-SM-5Q5CG
30-39 years, male
37.7
GTEX-1RAZA-0626-SM-EAZ4H
20-29 years, male
37.7
GTEX-11P82-0926-SM-5986X
20-29 years, male
37.6
GTEX-1I6K6-0626-SM-ARU7J
30-39 years, male
37.4
GTEX-1IDJC-1626-SM-AHZ2R
50-59 years, male
37.1
GTEX-1314G-2026-SM-5LZUM
30-39 years, male
37.0
GTEX-13VXT-1726-SM-5IFF5
20-29 years, female
36.9
GTEX-11P81-2026-SM-5P9GT
30-39 years, female
36.8
GTEX-178AV-1426-SM-6LLID
40-49 years, male
36.8
GTEX-1AYD5-2726-SM-7MXVG
50-59 years, male
36.8
GTEX-12WSN-2226-SM-5DUXT
40-49 years, male
36.7
GTEX-1S5ZU-0926-SM-HPAEX
20-29 years, female
36.7
GTEX-18D9U-2226-SM-7KFTN
40-49 years, male
36.6
GTEX-1HCU7-0126-SM-C1YR3
50-59 years, male
36.6
GTEX-1B97J-2126-SM-79OL6
50-59 years, female
36.4
GTEX-15EU6-2626-SM-7KUN4
50-59 years, male
36.2
GTEX-1R9K4-0526-SM-E76P1
60-69 years, male
35.9
GTEX-XV7Q-2426-SM-4BRV8
40-49 years, female
35.8
GTEX-1IKJJ-2826-SM-GA8ZM
60-69 years, male
35.7
GTEX-WOFM-2126-SM-4M9R4
20-29 years, male
35.7
GTEX-X261-2426-SM-4PQZU
50-59 years, male
35.6
GTEX-1GTWX-2526-SM-9JGHG
60-69 years, male
35.5
GTEX-1H1CY-2326-SM-9OSXW
60-69 years, female
35.4
GTEX-1QP9N-2026-SM-DPRZT
30-39 years, male
35.4
GTEX-1339X-2326-SM-5HL5B
40-49 years, male
35.2
GTEX-1C64N-2926-SM-79OLM
50-59 years, male
35.2
GTEX-1HFI6-2826-SM-GA91I
40-49 years, male
35.0
GTEX-1RNSC-2926-SM-EV79L
60-69 years, male
35.0
GTEX-1I6K7-0926-SM-A96SV
40-49 years, male
34.7
GTEX-1IDJV-2326-SM-GA8ZL
60-69 years, male
34.7
GTEX-X15G-2126-SM-4PQZR
50-59 years, female
34.7
GTEX-111FC-2926-SM-5GZY7
60-69 years, male
34.5
GTEX-1IY9M-2926-SM-A96TH
60-69 years, male
34.3
GTEX-1LVAM-0626-SM-HPAFZ
50-59 years, female
34.3
GTEX-13QBU-2126-SM-5KLZN
40-49 years, female
34.1
GTEX-1EH9U-2926-SM-7DHLX
60-69 years, male
34.1
GTEX-1I4MK-1326-SM-B2LWT
50-59 years, female
34.1
GTEX-Y5V6-2226-SM-4VDTC
60-69 years, male
34.0
GTEX-WH7G-2126-SM-4M1XU
40-49 years, male
33.9
GTEX-1B932-0626-SM-731EM
40-49 years, female
33.8
GTEX-14PN4-2526-SM-686ZG
50-59 years, male
33.4
GTEX-15SDE-1226-SM-HAV36
50-59 years, female
33.4
GTEX-1GZ2Q-2526-SM-9KNVW
40-49 years, male
33.4
GTEX-13111-2326-SM-5LZUQ
50-59 years, male
33.3
GTEX-Z9EW-1426-SM-HPAG9
40-49 years, male
33.2
GTEX-ZA64-1726-SM-5CVMF
20-29 years, male
32.9
GTEX-1HGF4-2326-SM-GA91Q
60-69 years, male
32.8
GTEX-1MGNQ-1926-SM-DTX8L
40-49 years, male
32.7
GTEX-1P4AB-2926-SM-EXOJR
50-59 years, male
32.7
GTEX-11EQ9-2026-SM-5P9JI
30-39 years, male
32.5
GTEX-1HSMQ-0926-SM-A96SI
50-59 years, male
32.4
GTEX-1LVA9-2526-SM-EVR5H
50-59 years, male
32.3
GTEX-1QP28-2026-SM-F2I3M
50-59 years, female
32.2
GTEX-13QJC-2326-SM-5Q5CD
60-69 years, female
32.1
GTEX-ZQUD-2126-SM-51MSY
30-39 years, male
32.0
GTEX-145ME-1626-SM-5RQI3
40-49 years, female
31.9
GTEX-WHSB-2326-SM-4M1XK
50-59 years, male
31.8
GTEX-14PJN-1726-SM-69LO7
30-39 years, male
31.4
GTEX-13JVG-2926-SM-5J2N9
60-69 years, male
31.3
GTEX-1LBAC-0626-SM-D3L9T
20-29 years, male
31.1
GTEX-1J8EW-2826-SM-A96T9
60-69 years, female
31.0
GTEX-XGQ4-2626-SM-4AT6B
50-59 years, male
31.0
GTEX-1IOXB-2826-SM-AHZ32
50-59 years, male
30.9
GTEX-1J8QM-1826-SM-A96TA
60-69 years, female
30.9
GTEX-1KD5A-2226-SM-EV79U
50-59 years, male
30.9
GTEX-1RQED-2926-SM-HPAFT
60-69 years, male
30.9
GTEX-1I1HK-2526-SM-A96SM
60-69 years, male
30.8
GTEX-17KNJ-2726-SM-7KFRE
50-59 years, male
30.7
GTEX-13113-1526-SM-5EGHV
60-69 years, female
30.5
GTEX-13NYB-2426-SM-5IFF4
40-49 years, male
30.5
GTEX-1445S-2926-SM-5O993
60-69 years, male
30.5
GTEX-1QCLZ-2526-SM-EXUST
60-69 years, female
30.5
GTEX-1R9PO-2626-SM-E6CPU
60-69 years, female
30.5
GTEX-XMK1-2626-SM-4B65R
40-49 years, male
30.5
GTEX-1GMR2-2026-SM-7MKHK
50-59 years, male
30.4
GTEX-1GN1W-2526-SM-9JGHX
50-59 years, female
30.4
GTEX-X5EB-1726-SM-4E3J7
40-49 years, male
30.1
GTEX-1MCC2-2226-SM-EV7AJ
30-39 years, female
29.9
GTEX-1LVAO-2626-SM-EVR4S
60-69 years, male
29.8
GTEX-13O21-1926-SM-5MR39
50-59 years, male
29.6
GTEX-1S83E-0626-SM-E9TKC
40-49 years, male
29.5
GTEX-1HSGN-0626-SM-A9G2E
40-49 years, female
29.1
GTEX-1LH75-2726-SM-HL11E
50-59 years, female
29.0
GTEX-Y111-2626-SM-4TT24
50-59 years, male
29.0
GTEX-WYVS-2026-SM-4RGNS
40-49 years, female
28.9
GTEX-ZE7O-2926-SM-51MSG
50-59 years, female
28.9
GTEX-1B8KZ-1726-SM-73KV7
50-59 years, male
28.8
GTEX-1GN1V-2926-SM-9JGI3
60-69 years, male
28.8
GTEX-X3Y1-1926-SM-4PQZO
40-49 years, male
28.8
GTEX-13NYC-2626-SM-5K7VN
60-69 years, male
28.7
GTEX-ZG7Y-2426-SM-DO11H
50-59 years, male
28.7
GTEX-1AX8Z-0626-SM-731EH
60-69 years, male
28.4
GTEX-1B8SF-1826-SM-731DJ
60-69 years, male
28.3
GTEX-1OJC4-3126-SM-EXOJK
50-59 years, female
28.3
GTEX-1HFI7-2426-SM-B2LXV
50-59 years, female
28.1
GTEX-1R9PM-1726-SM-E76T2
20-29 years, male
28.1
GTEX-13OVI-2326-SM-5KM47
60-69 years, female
28.0
GTEX-1LC47-2426-SM-DHXKK
60-69 years, male
28.0
GTEX-18A7B-2826-SM-7KFTK
70-79 years, male
27.9
GTEX-1AX9K-2126-SM-72D7K
50-59 years, male
27.8
GTEX-1IE54-0826-SM-AHZ2Z
40-49 years, female
27.5
GTEX-13G51-2426-SM-5LZY8
60-69 years, male
27.4
GTEX-Y3I4-1926-SM-4TT8L
50-59 years, male
27.3
GTEX-YF7O-2226-SM-5CVN8
50-59 years, male
27.3
GTEX-15RJE-2726-SM-6LPJ1
40-49 years, male
27.1
GTEX-15SHV-2226-SM-6M464
60-69 years, male
27.1
GTEX-1S82P-0726-SM-EVR4O
60-69 years, female
26.6
GTEX-146FR-1226-SM-5MR78
60-69 years, female
26.1
GTEX-1LKK1-2926-SM-EVR4Z
50-59 years, female
25.9
GTEX-1QEPI-0626-SM-E76QE
60-69 years, female
25.9
GTEX-1KANC-1326-SM-CYPT8
50-59 years, female
25.5
GTEX-1117F-3026-SM-5GZYU
60-69 years, female
24.9
GTEX-11ZTT-2226-SM-5CVLP
60-69 years, female
24.9
GTEX-131XF-2826-SM-5EGKH
60-69 years, male
24.9
GTEX-1AMEY-1126-SM-72D79
30-39 years, female
24.9
GTEX-W5X1-2426-SM-HPAGA
40-49 years, female
24.0
GTEX-1QMI2-0426-SM-EWRND
60-69 years, male
23.8
GTEX-1NSGN-0626-SM-E9J35
50-59 years, male
21.8
GTEX-ZC5H-2726-SM-5KLZW
40-49 years, female
19.3
GTEX-13CF2-2426-SM-5LZYL
60-69 years, male
17.8
GTEX-14JIY-3026-SM-6EU1R
60-69 years, male
11.6
Show allShow less
SALIVARY GLAND - FANTOM5 CAGEi
RNA expression in human tissues obtained through Cap Analysis of Gene Expression (CAGE) generated by the FANTOM5 project are reported as Scaled Tags Per Million.
Max subtype Scaled Tags Per Millioni
Max subtype Scaled Tags Per Million is the value for the subtype with the largest average Scaled Tags Per Million across the subtype samples.
Max subtype nTPM is the value for the subtype with the largest average nTPM across the subtype samples.
73.2
Macaque sample
Sample description
nTPM
Salivary gland nTPM: 73.2
Samples: 3
Max nTPM: 85.1
Min nTPM: 64.3
Sample C
64.3
Sample D
85.1
Sample E
70.1
SALIVARY GLAND - Pig RNA-seqi
RNA-seq data obtained from pig brain is reported as nTPM. Normal distribution across the dataset is visualized with box plots, shown as median and 25th and 75th percentiles. Points are displayed as outliers if they are above or below 1.5 times the interquartile range. nTPM values of the individual samples are presented next to the box plot.
Max subtype nTPMi
Max subtype nTPM is the value for the subtype with the largest average nTPM across the subtype samples.
22.8
Pig sample
Sample description
nTPM
Salivary gland nTPM: 22.8
Samples: 4
Max nTPM: 30.9
Min nTPM: 17.4
Sample A
Female
17.4
Sample B
Female
23.6
Sample C
Male
30.9
Sample D
Male
19.3
SALIVARY GLAND - Mouse RNA-seqi
RNA-seq data obtained from mouse brain is reported as nTPM. Normal distribution across the dataset is visualized with box plots, shown as median and 25th and 75th percentiles. Points are displayed as outliers if they are above or below 1.5 times the interquartile range. nTPM values of the individual samples are presented next to the box plot.
Max subtype nTPMi
Max subtype nTPM is the value for the subtype with the largest average nTPM across the subtype samples.
56.6
Mouse sample
Sample description
nTPM
Salivary gland nTPM: 56.6
Samples: 4
Max nTPM: 109.7
Min nTPM: 29.3
Sample D
57.6
Sample A
29.3
Sample B
29.7
Sample C
109.7
SALIVARY GLAND - Rat RNA-seq
Max subtype nTPMi
Max subtype nTPM is the value for the subtype with the largest average nTPM across the subtype samples.
55.0
Rat sample
Sample description
nTPM
Salivary gland nTPM: 55.1
Samples: 4
Max nTPM: 66.4
Min nTPM: 44.4
Sample A
49.3
Sample A
44.4
Sample A
66.4
Sample A
60.1
We use cookies to enhance the usability of our website. If you continue, we'll assume that you are happy to receive all cookies. More information. Don't show this again.


 The Human Protein Atlas project is funded