General description of the gene and the encoded protein(s) using information from HGNC and Ensembl, as well as predictions made by the Human Protein Atlas project.
Human gene namei
Official gene symbol, which is typically a short form of the gene name, according to HGNC.
All transcripts of all genes have been analyzed regarding the location(s) of corresponding protein based on prediction methods for signal peptides and transmembrane regions.
Genes with at least one transcript predicted to encode a secreted protein, according to prediction methods or to UniProt location data, have been further annotated and classified with the aim to determine if the corresponding protein(s) are secreted or actually retained in intracellular locations or membrane-attached.
Remaining genes, with no transcript predicted to encode a secreted protein, will be assigned the prediction-based location(s).
The annotated location overrules the predicted location, so that a gene encoding a predicted secreted protein that has been annotated as intracellular will have intracellular as the final location.
Intracellular
Antibodies in assayi
The internal antibody ID for the antibody/antibodies available for this specific target, click link for more antibody information.
The RNA data was used to cluster genes according to their expression across tissues. Clusters contain genes that have similar expression patterns, and each cluster has been manually annotated to describe common features in terms of function and specificity.
Not detected - no cluster assigned
Tissue specificityi
The RNA specificity category is based on mRNA expression levels in the consensus dataset which is calculated from the RNA expression levels in samples from HPA and GTEX. The categories include: tissue enriched, group enriched, tissue enhanced, low tissue specificity and not detected.
The tissue data for RNA expression obtained through Cap Analysis of Gene Expression (CAGE) generated by the FANTOM project are reported as Scaled Tags Per Million. Color-coding is based on tissue groups, each consisting of tissues with functional features in common. To access sample data, click on tissue name or bar.
The regional specificity category is based on mRNA expression levels in the analysed brain samples, grouped into 13 main brain regions and calculated for the three different species. All brain expression profiles are based on data from HPA. The specificity categories include: regionally enriched, group enriched, regionally enhanced, low regional specificity and not detected. The classification rules are the same used for the tissue specificity category.
Not detected
Domain specificity
Not detected
Tau specificity scorei
Tau specificity score is a numerical indicator of the specificity of the gene expression across cells or tissues. The value ranges from 0 and 1, where 0 indicates identical expression across all cells/tissue types, while 1 indicates expression in a single cell/tissue type.
Not detected
Regional distributioni
The regional distribution category is based on mRNA expression detected above cut off or not in the analysed brain samples, grouped into 13 main brain regions and calculated for the three different species. Brain expression for all species is based on data from HPA. The distribution categories include: detected in all, detected in many, detected in some, detected in single and not detected. The classification rules are the same used for the tissue distribution category.
Not detected
ASSAYSi
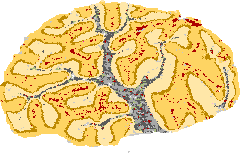
Links to data of the different assays available in the Tissue resource of the Human Protein Atlas. Click on the miniature images to directly get to the respective section.
The data is based on "bulk" RNAseq of micro-punched brain areas and brain nuclei. The size of the punches was adjusted to the size of the brain region to obtain detailed protein expression information on distinct cell populations. Multiple samples were collected from the same donors allowing a mild normalization and correction for individual variation. Data is expressed as normalized tags per million (nTPM). Protein expression data is organized on the 13 main brain structures representing the maximum value found in any of the brain areas that make up that structure. A detailed overview of the expression in any of the brain areas is summarized in bar plots for each brain structure.
Domain and subregion bars share a common scale (max 10 nTPM). Subregions are grouped by domain. Click a region for a detailed view.
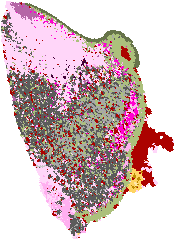
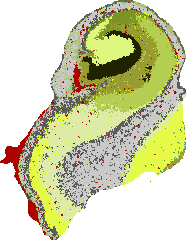
STEREO-SEQ HUMAN BRAINi
The left image is based on imputation of transcript location based on single cell co-expression. Only locations that are supported by neighboring transcripts are shown. All pixels are allocated to a cell-type mask indicated by color. It should be noted that these are predictions on transcript location and not real detection of transcripts.
The bar plot on the right reveals the counts per million of that transcript in each cell-type mask. This is calculated by counting all transcripts for all cell-type masks and for unassigned spots (noise). For each protein coding transcript the unassigned counts are subtracted from the counts in each cell-type. The noise corrected counts are used to calculate counts per million that is plotted as Enrichment change. Note that this is based on real measurements of counts.
The data is based on Siletti K et al. (2023) public data. Color-coding is based on cell type groups (as defined in the single cell type data representing the whole body), in this case separated into the main cell categories of neuron, glial cells, endothelial cells, fibroblasts and muscle cell (vascular smooth muscle cells and pericytes).
RNA cell type specificity:
Not detected
RNA cell type tau score:
Not detected
RNA neuronal cell type specificity:
Not detected
RNA neuronal cell type tau score:
Not detected
Single nuclei cell types
We use cookies to enhance the usability of our website. If you continue, we'll assume that you are happy to receive all cookies. More information. Don't show this again.


 The Human Protein Atlas project is funded