We use cookies to enhance the usability of our website. If you continue, we'll assume that you are happy to receive all cookies. More information. Don't show this again.
On the top, protein expression in current human tissue, based on all annotated cell types, is reported with the units not detected (n), low (l), medium (m) and high (h). Underneath, protein expression in each annotated cell type are reported using the same units. Protein expression data is based on knowledge-based annotation. For genes where more than one antibody has been used, a collective score is set. If knowledge-based annotation could not be performed for a gene, no data is displayed here. View antibody staining data further down this page.
h
m
l
n
Endothelial cells:
Low
Glial cells:
Medium
Neuronal cells:
High
Neuropil:
Low
RNA expressioni
A summary of mRNA expression data available for current tissue based on several datasets. The mRNA expression levels in human tissues are based on RNA-seq data generated by the Human Protein Atlas HPA, Genotype-Tissue Expression GTEx portal and CAGE data generated by the FANTOM5 consortium. Consensus normalized expression levels for human tissues was created by combining the data from HPA and GTEx datasets. The mRNA expression levels in pig brain are based on RNA-seq data generated by the Human Protein Atlas, and for mouse brain HPA data and in situ hybridization generated by the Allen brain atlas dataset are reported.
Scroll down to view mRNA expression data in more detail.
Consensus:
66.6
nTPM
HPA:
66.6
nTPM
HPA Brain:
297.2
nTPM
HPA PFC Brain:
45.6
nTPM
FANTOM5:
191.9
Scaled Tags Per Million
Pig:
120.5
nTPM
Mouse:
93.1
nTPM
Allen mouse:
12.0
Expression energy
CEREBRAL CORTEX - Antibody stainingi
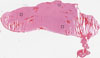
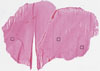
Antibody staining in the annotated cell types in the current human tissue is reported as not detected, low, medium, or high, based on conventional immunohistochemistry profiling in selected tissues. This score is based on the combination of the staining intensity and fraction of stained cells. Each image is clickable and will lead to virtual microscopy that enables deeper exploration of all samples and also displays staining intensity scores, fraction scores and subcellular localization as well as patient and tissue information for each sample.
Ascending and descending describe two types of gradient, based on difference in staining intensity between enterocytes in crypts and apical enterocytes.
Ascending - the staining intensity is stronger in apical enterocytes (towards the lumen) compared to enterocytes in the crypts (gland based)
Descending - the staining is weaker in apical enterocytes compared to enterocytes in crypts
Antibody HPA021022
Endothelial cells
Low
Glial cells
Medium
Neuronal cells
High
Neuropil
Low
CEREBRAL CORTEX - TISSUE (MS)i
The MS-based protein data details section shows detailed information about the individual samples used for the relative protein abundance measurements.
Intensity values provides a relative protein abundance comparable between different genes and samples. All samples comes from one female donor. Median detection value represents the tissue for specificity and distribution categories. Protein detection is defined as a non-missing intensity value, and protein values are set to missing for a tissue if more than half of its replicates lacked a measurement for that protein.
The RNA-seq details section shows detailed information about the individual samples used for the transcript profiling and results of the RNA-seq analysis.
Information about each individual sample is listed below, including gender, age, a tissue section image and estimated fractions of cell types. nTPM (normalized transcripts per million) values give a quantification of the gene abundance which is comparable between different genes and samples.
Average nTPMi
Max subtype nTPM is the value for the subtype with the largest average nTPM across the subtype samples.
66.6
Male, age 5
Cerebral cortex sample 48 nTPM: 91
Female, age 40
Cerebral cortex sample 105 nTPM: 45.5
Cell types%
Neuronal cells:
35
Glial cells and endothelial cells:
65
Male, age 70
Cerebral cortex sample 106 nTPM: 63.5
Cell types%
Neuronal cells:
35
Glial cells and endothelial cells:
65
CEREBRAL CORTEX - HPA Brain RNA-seq
Max subtype nTPMi
Max subtype nTPM is the value for the subtype with the largest average nTPM across the subtype samples.
RNA expression in human tissues obtained through Cap Analysis of Gene Expression (CAGE) generated by the FANTOM5 project are reported as Scaled Tags Per Million.
Max subtype Scaled Tags Per Millioni
Max subtype Scaled Tags Per Million is the value for the subtype with the largest average Scaled Tags Per Million across the subtype samples.
RNA-seq data obtained from pig brain is reported as nTPM. Normal distribution across the dataset is visualized with box plots, shown as median and 25th and 75th percentiles. Points are displayed as outliers if they are above or below 1.5 times the interquartile range. nTPM values of the individual samples are presented next to the box plot.
Max subtype nTPMi
Max subtype nTPM is the value for the subtype with the largest average nTPM across the subtype samples.
120.5
Pig sample
Sample description
nTPM
Occipital cortex nTPM: 108.5
Samples: 4
Max nTPM: 139.9
Min nTPM: 91.9
Sample A
Female
106.5
Sample B
Female
91.9
Sample C
Male
139.9
Sample D
Male
95.6
Retrosplenial cortex nTPM: 102.1
Samples: 4
Max nTPM: 125.4
Min nTPM: 90.0
Sample A
Female
90.0
Sample B
Female
95.9
Sample C
Male
125.4
Sample D
Male
96.9
Cingulate cortex nTPM: 102.3
Samples: 4
Max nTPM: 112.2
Min nTPM: 95.2
Sample A
Female
104.9
Sample B
Female
96.7
Sample C
Male
112.2
Sample D
Male
95.2
Insular cortex nTPM: 118.8
Samples: 4
Max nTPM: 129.2
Min nTPM: 102.3
Sample A
Female
124.0
Sample B
Female
102.3
Sample C
Male
129.2
Sample D
Male
119.8
Motor cortex nTPM: 115.6
Samples: 4
Max nTPM: 125.4
Min nTPM: 97.3
Sample A
Female
125.4
Sample B
Female
118.1
Sample C
Male
121.7
Sample D
Male
97.3
Prefrontal cortex nTPM: 120.5
Samples: 4
Max nTPM: 130.3
Min nTPM: 114.8
Sample A
Female
130.3
Sample B
Female
118.6
Sample C
Male
118.3
Sample D
Male
114.8
Somatosensory cortex nTPM: 118.3
Samples: 3
Max nTPM: 121.2
Min nTPM: 115.4
Sample B
Female
115.4
Sample C
Male
118.2
Sample D
Male
121.2
Temporal cortex nTPM: 105.9
Samples: 4
Max nTPM: 139.7
Min nTPM: 91.7
Sample A
Female
94.3
Sample B
Female
139.7
Sample C
Male
97.8
Sample D
Male
91.7
CEREBRAL CORTEX - Mouse RNA-seqi
RNA-seq data obtained from mouse brain is reported as nTPM. Normal distribution across the dataset is visualized with box plots, shown as median and 25th and 75th percentiles. Points are displayed as outliers if they are above or below 1.5 times the interquartile range. nTPM values of the individual samples are presented next to the box plot.
Max subtype nTPMi
Max subtype nTPM is the value for the subtype with the largest average nTPM across the subtype samples.
93.1
Mouse sample
Sample description
nTPM
Occipital cortex nTPM: 80.1
Samples: 4
Max nTPM: 86.9
Min nTPM: 70.5
Sample A
Male
79.5
Sample B
Male
86.9
Sample C
Female
83.5
Sample D
Female
70.5
Frontal cortex nTPM: 91.0
Samples: 4
Max nTPM: 101.4
Min nTPM: 79.8
Sample A
Male
79.8
Sample B
Male
83.2
Sample C
Female
99.7
Sample D
Female
101.4
Retrosplenial and cingulate cortex nTPM: 93.1
Samples: 4
Max nTPM: 100.0
Min nTPM: 85.6
Sample A
Male
85.6
Sample B
Male
90.4
Sample C
Female
100.0
Sample D
Female
96.3
Somatosensory cortex nTPM: 67.6
Samples: 4
Max nTPM: 88.0
Min nTPM: 57.3
Sample A
Male
63.3
Sample B
Male
57.3
Sample C
Female
88.0
Sample D
Female
61.7
CEREBRAL CORTEX - Allen Mouse ISHi
In situ hybridization (ISH) data generated by the Allen brain atlas from mouse brain is reported as expression energy. For more details about a particular experiment, click on the corresponding Allen experiment ID.
Max subtype Expression energyi
Max subtype Expression energy is the value for the subtype with the largest average Expression energy across the subtype samples.
 The Human Protein Atlas project is funded