Search result

BETA

|
Correlation between antibody- and aptamer-based plasma proteome measurementsDisease-specific correlationProtein detection reliability as a driver of cross-platform correlation
Disease atlas methods

Correlation between antibody- and aptamer-based plasma proteome measurementsOlink Explore HT and SomaScan 11k are two widely used affinity-based platforms for large-scale plasma proteomics, differing in their underlying detection chemistries, assay designs, and target coverage. To assess the concordance between measurements from both platforms, Spearman rank correlations were calculated for all proteins targeted by common assays across both technologies, using 2,621 matched plasma samples from the same individuals. In SomaScan, individual proteins can be targeted by multiple aptamers with distinct epitope specificity, resulting in multiple protein-aptamer pairs available for some target proteins. The distribution of per-protein-aptamer Spearman correlations is bimodal, with a large fraction of proteins showing near-zero correlation and a distinct second peak at approximately 0.8, indicating that a subset of proteins is highly concordant between the two platforms while another subset shows limited agreement. 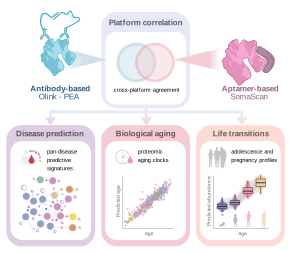
This pattern is consistent with observations in previous cross-platform comparisons and likely reflects differences in epitope specificity, assay sensitivity, and protein isoform recognition between the two technologies.
Figure 1. Histogram showing the distribution of Spearman correlations across protein-aptamer pairs. Disease-specific correlation
Figure 2. Heatmap comparing Spearman correlations of protein-aptamer pairs between baseline and disease-specific conditions.
Protein detection reliability as a driver of cross-platform correlationA key determinant of cross-platform concordance is the proportion of samples in which a protein is reliably detected above the limit of detection (LOD). For each protein, a sample was classified as below LOD if either the Olink or the SomaScan measurement fell below the respective platform's LOD threshold; the proportion of Olink measurements below LOD was substantially greater than for SomaScan. The distribution of proteins by percentage of samples above LOD is strongly bimodal, with the majority of proteins either detected in fewer than 10% of samples or detected reliably across all samples. Median Spearman correlation increases with the fraction of samples above LOD, reaching values above 0.5 for proteins detected in more than 90% of samples, demonstrating that detection reliability is a primary driver of cross-platform agreement. Proteins with low detection rates in either platform should therefore be interpreted with caution when comparing measurements across technologies. More information about sample selection, LOD definitions, and correlation methodology can be found in the Method summary. Figure 3. Trends in Spearman correlations by assay detectability. The histogram shows the number of proteins at different detectability levels, defined as the percentage of samples per protein above LOD in either Olink or SomaScan. The line plot shows the median correlation at each detectability level. |
|||||||||||||||||||||||||||||||||||||||||||||||||||||||||||||||||||||||||||||||||||||||||||||||||||||||||||||||||||||||||||||||||||||||||||||||||||||||||||||||||||||||||||||||||||||||||||||||||||||||||||||||||||||||||||||||||||||||||||||||||||||||||||||||||||||||||||||||||||||||||||||||||||||||||||||||||||||||||||||||||||||||||||||||||||||||||||||||||||||||||||||||||||||||||||||||||||||||||||||||||||||||||||||||||||||||||||||||||||||||||||||||||||||||||||||||||||||||||||||||||||||||||||||||||||||||||||||||||||||||||||||||||||||||||||||||||||||||||||||||||||||||||||||||||||||||||||||||||||||||||||||||||||||||||||||||||||||||||||||||||||||||||||||||||||||||||||||||||||||||||||||||||||||||||||||||||||||||||||||||||||||||||||||||||||||||||||||||||||||||||||||||||||||||||||||||||||||||||||||||||||||||||||||||||||||||||||||||||||||||||||||||||||||||||||||||||||||||||||||||||||||||||||||||||||||||||||||||||||||||||||||||||||||||||||||||||||||||||||||||||||||||||||||||||||||||||||||||||||||||
 The Human Protein Atlas project is funded


