UCHL5
HPA
RESOURCES
  • TISSUE
  • BRAIN
  • SINGLE CELL
  • IMMUNE CELL
  • SUBCELLULAR
  • CANCER
  • BLOOD
  • CELL LINE
  • STRUCTURE
  • INTERACTION
  • METABOLIC
  • ISOFORM
  • EVOLUTIONARY
ABOUT
  • INTRODUCTION
  • HISTORY
  • ORGANIZATION
  • PUBLICATIONS
  • ACKNOWLEDGMENTS
  • CONTACT
NEWS
  • NEWS ARTICLES
  • PRESS ROOM
LEARN
  • DICTIONARY
  • PROTEIN CLASSES
  • PROTEIN EVIDENCE
  • METHODS
  • AI IMPLEMENTATIONS
  • EDUCATIONAL VIDEOS
DATA
  • DOWNLOADABLE DATA
  • PUBLICATION DATA
  • RELEASE HISTORY
HELP
  • HELP & FAQ
  • ANTIBODY AVAILABILITY
  • DISCLAIMER
  • PRIVACY STATEMENT
  • LICENCE & CITATION
Fields »
Search result

Field
Term
Gene name
Class
Subclass
Category
Keyword
Chromosome
External id
Tissue
Cell type
Expression
Antibody panel
Tissue
Main location
Patient ID
Annotation
Tissue
Category
Tau score
Tissue
Category
Tau score
Tissue
Category
Tau score
Cluster
Reliability
Region
Niche
Category
Brain region
Category
Tau score
Brain domain
Category
Tau score
Cell type
Category
Tau score
Cell type
Category
Tau score
Brain region
Category
Tau score
Brain region
Category
Tau score
Brain region
Category
Tau score
Brain region
Category
Tau score
Cluster
Reliability
Cell type
Category
Tau score
Cell type group
Category
Tau score
Single cell
Category
Tau score
Single cell
Category
Tau score
Annotation
Annotation
Annotation
Tissue
Cell type
Enrichment
Cluster
Cell type
Category
Tau score
Cell lineage
Category
Tau score
Cluster
Location
Searches
Location
Cell line
Class
Type
Phase
Reliability
Cancer
Prognosis
Cancer
Regulation
Cancer
Regulation
Cancer
Category
Cancer
Category
Tau score
Correlation
Cancer
Category
Tau score
Cluster
Variants
Source
PTM
ipTM
Interacting gene (ensg_id)
Type
Number of interactions
Type
Heterodimer
Subsystem
Isoforms
Specificity
Expression
Species
Ortholog
Type
Species
Tissue
Category
Species
Tau score
Data
Category
Data
Species
Category
Category
Category
Category
Category
Validation
Validation
Validation
Validation
Antibodies
Data type
Column


BETA
  • SUMMARY

  • TISSUE

  • BRAIN

  • SINGLE CELL

  • IMMUNE

  • SUBCELL

  • CANCER

  • BLOOD

  • CELL LINE

  • STRUCTURE

  • INTERACTION

  • METABOLIC

  • ISOFORM

  • EVOLUTION

  • UCHL5
Protein interactions
Interaction methods
GENERAL INFORMATIONi

General description of the gene and the encoded protein(s) using information from HGNC and Ensembl, as well as predictions made by the Human Protein Atlas project.

Gene namei

Official gene symbol, which is typically a short form of the gene name, according to HGNC.

UCHL5
Synonyms CGI-70, INO80R, UCH37
Gene descriptioni

Full gene name according to HGNC.

Ubiquitin C-terminal hydrolase L5
Protein classi

Assigned HPA protein class(es) for the encoded protein(s).

Enzymes
Essential proteins
Housekeeping proteins
Plasma proteins
Predicted locationi

All transcripts of all genes have been analyzed regarding the location(s) of corresponding protein based on prediction methods for signal peptides and transmembrane regions.

  • Genes with at least one transcript predicted to encode a secreted protein, according to prediction methods or to UniProt location data, have been further annotated and classified with the aim to determine if the corresponding protein(s) are secreted or actually retained in intracellular locations or membrane-attached.
  • Remaining genes, with no transcript predicted to encode a secreted protein, will be assigned the prediction-based location(s).

The annotated location overrules the predicted location, so that a gene encoding a predicted secreted protein that has been annotated as intracellular will have intracellular as the final location.

Intracellular
Protein evidence Evidence at protein level (all genes)

HUMAN PROTEIN ATLAS INFORMATIONi

Summary of RNA expression analysis and annotation data generated within the Human Protein Atlas project.

Single cell type
expression clusteri

The RNA data was used to cluster genes according to their expression across single cell types. Clusters contain genes that have similar expression patterns, and each cluster has been manually annotated to describe common features in terms of function and specificity.

Non-specific - Transcription & Protein QC (mainly)
Single cell type specificityi

The RNA specificity category is based on mRNA expression levels in the analyzed cell types based on scRNA-seq data from normal tissues. The categories include: cell type enriched, group enriched, cell type enhanced, low cell type specificity and not detected.

Low cell type specificity
Tissue expression
cluster (RNA)i

The RNA data was used to cluster genes according to their expression across tissues. Clusters contain genes that have similar expression patterns, and each cluster has been manually annotated to describe common features in terms of function and specificity.

Non-specific - Basic cellular processes (mainly)
Tissue specificity (RNA)i

The RNA specificity category is based on mRNA expression levels in the consensus dataset which is calculated from the RNA expression levels in samples from HPA and GTEX. The categories include: tissue enriched, group enriched, tissue enhanced, low tissue specificity and not detected.

Low tissue specificity
Subcellular locationi

Main subcellular location based on data generated in the subcellular section of the Human Protein Atlas.

Localized to the Nucleoplasm, Cytosol In addition localized to the Nucleoli
Secretome annotationi

All genes with at least one predicted secreted isoform have been annotated and classified with the aim to determine if the corresponding protein(s) are:

  • secreted into blood
  • locally secreted
  • or actually being attached to membrane or retained in intracellular locations like mitochondria, endoplasmatic reticulum (ER), Golgi apparatus or lysosomes.
Not available
GENE INFORMATIONi

Gene information from Ensembl and Entrez, as well as links to available gene identifiers are displayed here. Information was retrieved from Ensembl if not indicated otherwise.

Chromosome 1
Cytoband q31.2
Chromosome location (bp) 193012250 - 193060080
Number of transcriptsi

Number of protein-coding transcripts from the gene as defined by Ensembl.

12
Ensembl ENSG00000116750 (version 109)
Entrez gene 51377
HGNC HGNC:19678
UniProt Q9Y5K5
GeneCards UCHL5
INTERACTIONi

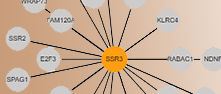
In the Interaction resource network plots showing the gene's first-level interaction partners according to five different datasets are displayed, including a consensus network plot showing only interactions present in at least two of the datasets and an aggregated network displaying interaction from all datasets.Dashed line edges represent interaction pairs only predicted by the deep learning model RosettaFold2-PPI. By clicking on nodes the network can be expanded. In the network plots the nodes represent genes and edge color represent the number of datasets the interaction belongs to. In-house generated AlphaFold 3 predicted 3D structures for interactions in the consensus network are displayed by clicking on the blue symbols on the edges. A blue square on the edge indicate a known heterodimer based on data in the ComplexPortal.

The highlight bar in the top of the plot can be used to color the nodes according to subcellular location (based on data in the Subcellular section), predicted location (based on signalpeptide and transmembrane region predictions), tissue specificity (based on RNA tissue expression profiles), single cell cluster or proteinclass. For genes categorised as single cell type or group specific the option to highlight interaction partners expressed in the same cell type will also be available in the highlight bar.

Custom highlighting of nodes is possible using the top left Filter option in which a query of choice can be built to for example label all nodes that are tissue enriched in both human and mouse brain or those that belongs to a certain tissue expression cluster. The expression cluster for the gene is stated in the box Human Protein Atlas Information above the network plot. Click on Filter in the top left in the plot to find the query builder and some example queries.

Experimentally verified interactions included are direct interaction and physical associations with high and medium confidence from IntAct, physical multivalidated interactions from BioGRID, interactions with>75% probability from BioPlex and significant physical interactions from OpenCell. High precision predicted interactions based on the deep learning model RosettaFold2-PPI are also presented.

Highlight:
Off
Subcell location
Predicted location
Cell type specificity
Cell type cluster
Protein class
Filter menu »
Fields »
e.g. Brain enriched, Localized to mitochondria, Non-specific - Basic cellular processes

Field
Term
Gene name
Class
Subclass
Category
Keyword
Chromosome
External id
Tissue
Cell type
Expression
Antibody panel
Tissue
Main location
Patient ID
Annotation
Tissue
Category
Tau score
Tissue
Category
Tau score
Tissue
Category
Tau score
Cluster
Reliability
Region
Niche
Category
Brain region
Category
Tau score
Brain domain
Category
Tau score
Cell type
Category
Tau score
Cell type
Category
Tau score
Brain region
Category
Tau score
Brain region
Category
Tau score
Brain region
Category
Tau score
Brain region
Category
Tau score
Cluster
Reliability
Cell type
Category
Tau score
Cell type group
Category
Tau score
Single cell
Category
Tau score
Single cell
Category
Tau score
Annotation
Annotation
Annotation
Tissue
Cell type
Enrichment
Cluster
Cell type
Category
Tau score
Cell lineage
Category
Tau score
Cluster
Location
Searches
Location
Cell line
Class
Type
Phase
Reliability
Cancer
Prognosis
Cancer
Regulation
Cancer
Regulation
Cancer
Category
Cancer
Category
Tau score
Correlation
Cancer
Category
Tau score
Cluster
Variants
Source
PTM
ipTM
Interacting gene (ensg_id)
Type
Number of interactions
Type
Heterodimer
Subsystem
Isoforms
Specificity
Expression
Species
Ortholog
Type
Species
Tissue
Category
Species
Tau score
Data
Category
Data
Species
Category
Category
Category
Category
Category
Validation
Validation
Validation
Validation
Antibodies
Data type
Column


Consensus
Aggregated
IntAct
BioGrid
OpenCell
BioPlex
Rosettafold2-PPI

Non-commercial use only, subject to AlphaFold3 Output Terms of Use

Interaction:
Color scheme:
Confidence
Antibodies
Interactor
Show surface:
Off
On
Autorotate:
Off
On
PAE plot
Number of interactions: 38
Interaction# Consensus# Aggregated# IntAct# BioGrid# OpenCell# BioPlex# Rosettafold2-PPI
ACTR88222152122
ADRM116608541133
INO80E124019151164
NFRKB525117908
PSMA1362011458124011
PSMA242711064402914
PSMA32013353921306
PSMA43979156841107
PSMA54075666442211
PSMA62894266827914
PSMB143141846343209
PSMB23178146427197
PSMB334661452312011
PSMB43383315521237
PSMB5236817551889
PSMB624546502077
PSMB73563115329268
PSMC23592167934153
PSMC34595227543213
PSMC4439317745903
PSMC5321433112119254
PSMC63691466333132
PSMD1227310721900
PSMD102151214016212
PSMD113873176139138
PSMD12417696147205
PSMD13356120543906
PSMD241120319940130
PSMD341114169153158
PSMD4381113410224164
PSMD63971305929133
PSMD72364115420168
PSME4204742535120
RUVBL1491451613329393
RUVBL26719711148103335
SEM1147812335000
TFPT145614200373
YY11713847931760
Show allShow less
Number of interactions: 84
Interaction# Consensus# Aggregated# IntAct# BioGrid# OpenCell# BioPlex# Rosettafold2-PPI
ACTB7529627209111345
ACTL6A227019592404
ACTR59289165121
ACTR88222152122
ADRM116608541133
ARG10403001
AXIN111724442200
BRD434986495025
CAPZB1037036136666010
CSNK2B5626632122154374
CTSD137229340
DDI20909000
E2F19892077006
ECPAS77783913240
ELK301194000
H4C13139756366059
HAUS73201111103
HSPA5373693726725864
HUWE142146211200
INO80929521678
INO80B8704920066
INO80C9203143131
INO80D012012003
INO80E124019151164
MCRS1313398400012
NFRKB525117908
NOS2015110004
PAAF1142813261502
PRDX13611047614
PRKN814091214060017
PSMA1362011458124011
PSMA242711064402914
PSMA32013353921306
PSMA43979156841107
PSMA54075666442211
PSMA62894266827914
PSMA73481206831812
PSMB143141846343209
PSMB23178146427197
PSMB334661452312011
PSMB43383315521237
PSMB5236817551889
PSMB624546502077
PSMB73563115329268
PSMC13490247533142
PSMC23592167934153
PSMC34595227543213
PSMC4439317745903
PSMC5321433112119254
PSMC63691466333132
PSMD1227310721900
PSMD102151214016212
PSMD113873176139138
PSMD12417696147205
PSMD13356120543906
PSMD14131259120387
PSMD241120319940130
PSMD341114169153158
PSMD4381113410224164
PSMD515469380161
PSMD63971305929133
PSMD72364115420168
PSMD81055551384
PSME4204742535120
PSMF1845191514121
PSMG112333152803
RAD23A9814239156
RAD23B7601648024
RUVBL1491451613329393
RUVBL26719711148103335
SEM1147812335000
SMAD31515353128020
SMAD7449747000
SQSTM127534405162031
TCF71523001
TFPT145614200373
TXNL1022021101
UBC3251759490400
UBE3A71208117106
UBLCP11341210130
USP14880178901
XPO52403140250
YY11713847931760
ZBED1139358000
Show allShow less
Number of interactions: 9 View all protein interaction data in IntAct
Interaction# Consensus# Aggregated# IntAct# BioGrid# OpenCell# BioPlex# Rosettafold2-PPI
ACTR88222152122
ADRM116608541133
INO80E124019151164
NFRKB525117908
PSMA62894266827914
PSMD241120319940130
PSMD4381113410224164
TFPT145614200373
ZBED1139358000
Number of interactions: 79
Interaction# Consensus# Aggregated# IntAct# BioGrid# OpenCell# BioPlex# Rosettafold2-PPI
ACTB7529627209111345
ACTL6A227019592404
ACTR59289165121
ACTR88222152122
ADRM116608541133
ARG10403001
AXIN111724442200
BRD434986495025
CTSD137229340
DDI20909000
E2F19892077006
ECPAS77783913240
ELK301194000
H4C13139756366059
HAUS73201111103
HSPA5373693726725864
HUWE142146211200
INO80929521678
INO80B8704920066
INO80C9203143131
INO80D012012003
INO80E124019151164
MCRS1313398400012
NFRKB525117908
NOS2015110004
PAAF1142813261502
PRDX13611047614
PRKN814091214060017
PSMA1362011458124011
PSMA242711064402914
PSMA32013353921306
PSMA43979156841107
PSMA54075666442211
PSMA62894266827914
PSMA73481206831812
PSMB143141846343209
PSMB23178146427197
PSMB334661452312011
PSMB43383315521237
PSMB5236817551889
PSMB624546502077
PSMB73563115329268
PSMC13490247533142
PSMC23592167934153
PSMC34595227543213
PSMC4439317745903
PSMC5321433112119254
PSMC63691466333132
PSMD1227310721900
PSMD102151214016212
PSMD113873176139138
PSMD12417696147205
PSMD13356120543906
PSMD14131259120387
PSMD241120319940130
PSMD341114169153158
PSMD4381113410224164
PSMD515469380161
PSMD63971305929133
PSMD72364115420168
PSMD81055551384
PSME4204742535120
RAD23A9814239156
RAD23B7601648024
RUVBL1491451613329393
RUVBL26719711148103335
SEM1147812335000
SMAD31515353128020
SMAD7449747000
SQSTM127534405162031
TCF71523001
TFPT145614200373
TXNL1022021101
UBC3251759490400
UBE3A71208117106
UBLCP11341210130
USP14880178901
XPO52403140250
YY11713847931760
Show allShow less
Number of interactions: 37
Interaction# Consensus# Aggregated# IntAct# BioGrid# OpenCell# BioPlex# Rosettafold2-PPI
CAPZB1037036136666010
CSNK2B5626632122154374
PSMA1362011458124011
PSMA242711064402914
PSMA32013353921306
PSMA43979156841107
PSMA54075666442211
PSMA62894266827914
PSMB143141846343209
PSMB23178146427197
PSMB334661452312011
PSMB43383315521237
PSMB5236817551889
PSMB624546502077
PSMB73563115329268
PSMC23592167934153
PSMC34595227543213
PSMC4439317745903
PSMC5321433112119254
PSMC63691466333132
PSMD1227310721900
PSMD102151214016212
PSMD113873176139138
PSMD12417696147205
PSMD13356120543906
PSMD241120319940130
PSMD341114169153158
PSMD4381113410224164
PSMD63971305929133
PSMD72364115420168
PSME4204742535120
PSMF1845191514121
PSMG112333152803
RUVBL1491451613329393
RUVBL26719711148103335
SEM1147812335000
YY11713847931760
Show allShow less
UCHL5 has no defined protein interactions in BioPlex.
Number of interactions: 2
Interaction# Consensus# Aggregated# IntAct# BioGrid# OpenCell# BioPlex# Rosettafold2-PPI
ADRM116608541133
NFRKB525117908
PROTEIN INFORMATIONi

The protein information section displays alternative protein-coding transcripts (splice variants) encoded by this gene according to the Ensembl database.

The Splice variant identifier links to the Ensembl website protein summary for the selected splice variant. The data in the Swissprot and TrEMBL columns links to corresponding pages in the UniProt database.

The protein classes assigned to this protein are shown if expanding the data in the protein class column. Parent protein classes are in bold font and subclasses are listed under the parent class.

The length of the protein (amino acid residues according to Ensembl), molecular mass (kDalton), predicted signal peptide and number of predicted transmembrane region(s) according to in-house majority decision methods based on sets of predictors are also reported.

Splice variant SwissProt TrEMBL Protein class Length & mass Signal peptide
(predicted)
Transmembrane regions
(predicted)
UCHL5-201 Q9Y5K5
Enzymes
Housekeeping proteins
Predicted intracellular proteins
Plasma proteins
Mapped to neXtProt
Protein evidence (Kim et al 2014)
Essential proteins
Protein evidence (Ezkurdia et al 2014)
Show all
326 aa
37.4 kDa
No 0
UCHL5-202 Q9Y5K5
Enzymes
Housekeeping proteins
Predicted intracellular proteins
Plasma proteins
Mapped to neXtProt
Protein evidence (Kim et al 2014)
Essential proteins
Protein evidence (Ezkurdia et al 2014)
Show all
316 aa
36.1 kDa
No 0
UCHL5-203 Q5LJA9
Housekeeping proteins
Predicted intracellular proteins
Essential proteins
Protein evidence (Ezkurdia et al 2014)
368 aa
41.7 kDa
No 0
UCHL5-204 Q5LJA5
Housekeeping proteins
Predicted intracellular proteins
Essential proteins
Protein evidence (Ezkurdia et al 2014)
355 aa
40.4 kDa
No 0
UCHL5-205 Q9Y5K5
Enzymes
Housekeeping proteins
Predicted intracellular proteins
Plasma proteins
Mapped to neXtProt
Protein evidence (Kim et al 2014)
Essential proteins
Protein evidence (Ezkurdia et al 2014)
Show all
328 aa
37.5 kDa
No 0
UCHL5-206 Q9Y5K5
Enzymes
Housekeeping proteins
Predicted intracellular proteins
Plasma proteins
Mapped to neXtProt
Protein evidence (Kim et al 2014)
Essential proteins
Protein evidence (Ezkurdia et al 2014)
Show all
329 aa
37.6 kDa
No 0
UCHL5-207 H0Y4K0
Housekeeping proteins
Predicted intracellular proteins
Essential proteins
Protein evidence (Ezkurdia et al 2014)
99 aa
11.6 kDa
No 0
UCHL5-208 Q5LJB1
Housekeeping proteins
Predicted intracellular proteins
Essential proteins
Protein evidence (Ezkurdia et al 2014)
165 aa
18.3 kDa
No 0
UCHL5-209 H0Y6Y4
Housekeeping proteins
Predicted intracellular proteins
Essential proteins
Protein evidence (Ezkurdia et al 2014)
218 aa
25.3 kDa
No 0
UCHL5-210 Q5LJB0
Housekeeping proteins
Predicted intracellular proteins
Essential proteins
Protein evidence (Ezkurdia et al 2014)
258 aa
29.1 kDa
No 0
UCHL5-211 H0Y4E0
Housekeeping proteins
Predicted intracellular proteins
Essential proteins
Protein evidence (Ezkurdia et al 2014)
183 aa
21.4 kDa
No 0
UCHL5-212 H0Y636
Housekeeping proteins
Predicted intracellular proteins
Essential proteins
Protein evidence (Ezkurdia et al 2014)
115 aa
13.6 kDa
No 0
Show allShow less

Contact

  • NEWS ARTICLES
  • PRESS ROOM

The Project

  • INTRODUCTION
  • ORGANIZATION
  • PUBLICATIONS

The Human Protein Atlas

  • DOWNLOADABLE DATA
  • LICENCE & CITATION
  • HELP & FAQ
KAW logo The Human Protein Atlas project is funded
by the Knut and Alice Wallenberg Foundation.

Facebook logo X logo Bluesky logo Linkedin logo RSS feed logo contact@proteinatlas.org
GCBR logo Elixir core logo SciLifeLab logo Uppsala university logo KI logo KTH logo
We use cookies to enhance the usability of our website. If you continue, we'll assume that you are happy to receive all cookies. More information. Don't show this again.