XPA
HPA
RESOURCES
  • TISSUE
  • BRAIN
  • SINGLE CELL
  • IMMUNE CELL
  • SUBCELLULAR
  • CANCER
  • BLOOD
  • CELL LINE
  • STRUCTURE
  • INTERACTION
  • METABOLIC
  • ISOFORM
  • EVOLUTIONARY
ABOUT
  • INTRODUCTION
  • HISTORY
  • ORGANIZATION
  • PUBLICATIONS
  • ACKNOWLEDGMENTS
  • CONTACT
NEWS
  • NEWS ARTICLES
  • PRESS ROOM
LEARN
  • DICTIONARY
  • PROTEIN CLASSES
  • PROTEIN EVIDENCE
  • METHODS
  • AI IMPLEMENTATIONS
  • EDUCATIONAL VIDEOS
DATA
  • DOWNLOADABLE DATA
  • PUBLICATION DATA
  • RELEASE HISTORY
HELP
  • HELP & FAQ
  • ANTIBODY AVAILABILITY
  • DISCLAIMER
  • PRIVACY STATEMENT
  • LICENCE & CITATION
Fields »
Search result

Field
Term
Gene name
Class
Subclass
Category
Keyword
Chromosome
External id
Tissue
Cell type
Expression
Antibody panel
Tissue
Main location
Patient ID
Annotation
Tissue
Category
Tau score
Tissue
Category
Tau score
Tissue
Category
Tau score
Cluster
Reliability
Region
Niche
Category
Brain region
Category
Tau score
Brain domain
Category
Tau score
Cell type
Category
Tau score
Cell type
Category
Tau score
Brain region
Category
Tau score
Brain region
Category
Tau score
Brain region
Category
Tau score
Brain region
Category
Tau score
Cluster
Reliability
Cell type
Category
Tau score
Cell type group
Category
Tau score
Single cell
Category
Tau score
Single cell
Category
Tau score
Annotation
Annotation
Annotation
Tissue
Cell type
Enrichment
Cluster
Cell type
Category
Tau score
Cell lineage
Category
Tau score
Cluster
Location
Searches
Location
Cell line
Class
Type
Phase
Reliability
Cancer
Prognosis
Cancer
Regulation
Cancer
Regulation
Cancer
Category
Cancer
Category
Tau score
Correlation
Cancer
Category
Tau score
Cluster
Variants
Source
PTM
ipTM
Interacting gene (ensg_id)
Type
Number of interactions
Type
Heterodimer
Subsystem
Isoforms
Specificity
Expression
Species
Ortholog
Type
Species
Tissue
Category
Species
Tau score
Data
Category
Data
Species
Category
Category
Category
Category
Category
Validation
Validation
Validation
Validation
Antibodies
Data type
Column


BETA
  • SUMMARY

  • TISSUE

  • BRAIN

  • SINGLE CELL

  • IMMUNE

  • SUBCELL

  • CANCER

  • BLOOD

  • CELL LINE

  • STRUCTURE

  • INTERACTION

  • METABOLIC

  • ISOFORM

  • EVOLUTION

  • XPA
Protein interactions
Interaction methods
GENERAL INFORMATIONi

General description of the gene and the encoded protein(s) using information from HGNC and Ensembl, as well as predictions made by the Human Protein Atlas project.

Gene namei

Official gene symbol, which is typically a short form of the gene name, according to HGNC.

XPA
Synonyms XP1, XPAC
Gene descriptioni

Full gene name according to HGNC.

XPA, DNA damage recognition and repair factor
Protein classi

Assigned HPA protein class(es) for the encoded protein(s).

Cancer-related genes
Disease related genes
Housekeeping proteins
Human disease related genes
Predicted locationi

All transcripts of all genes have been analyzed regarding the location(s) of corresponding protein based on prediction methods for signal peptides and transmembrane regions.

  • Genes with at least one transcript predicted to encode a secreted protein, according to prediction methods or to UniProt location data, have been further annotated and classified with the aim to determine if the corresponding protein(s) are secreted or actually retained in intracellular locations or membrane-attached.
  • Remaining genes, with no transcript predicted to encode a secreted protein, will be assigned the prediction-based location(s).

The annotated location overrules the predicted location, so that a gene encoding a predicted secreted protein that has been annotated as intracellular will have intracellular as the final location.

Intracellular
Protein evidence Evidence at protein level (all genes)

HUMAN PROTEIN ATLAS INFORMATIONi

Summary of RNA expression analysis and annotation data generated within the Human Protein Atlas project.

Single cell type
expression clusteri

The RNA data was used to cluster genes according to their expression across single cell types. Clusters contain genes that have similar expression patterns, and each cluster has been manually annotated to describe common features in terms of function and specificity.

Non-specific - Cellular respiration (mainly)
Single cell type specificityi

The RNA specificity category is based on mRNA expression levels in the analyzed cell types based on scRNA-seq data from normal tissues. The categories include: cell type enriched, group enriched, cell type enhanced, low cell type specificity and not detected.

Low cell type specificity
Tissue expression
cluster (RNA)i

The RNA data was used to cluster genes according to their expression across tissues. Clusters contain genes that have similar expression patterns, and each cluster has been manually annotated to describe common features in terms of function and specificity.

Non-specific - Signal transduction (mainly)
Tissue specificity (RNA)i

The RNA specificity category is based on mRNA expression levels in the consensus dataset which is calculated from the RNA expression levels in samples from HPA and GTEX. The categories include: tissue enriched, group enriched, tissue enhanced, low tissue specificity and not detected.

Low tissue specificity
Subcellular locationi

Main subcellular location based on data generated in the subcellular section of the Human Protein Atlas.

Localized to the Nuclear bodies In addition localized to the Nucleoplasm, Cytosol
Secretome annotationi

All genes with at least one predicted secreted isoform have been annotated and classified with the aim to determine if the corresponding protein(s) are:

  • secreted into blood
  • locally secreted
  • or actually being attached to membrane or retained in intracellular locations like mitochondria, endoplasmatic reticulum (ER), Golgi apparatus or lysosomes.
Not available
GENE INFORMATIONi

Gene information from Ensembl and Entrez, as well as links to available gene identifiers are displayed here. Information was retrieved from Ensembl if not indicated otherwise.

Chromosome 9
Cytoband q22.33
Chromosome location (bp) 97674909 - 97697340
Number of transcriptsi

Number of protein-coding transcripts from the gene as defined by Ensembl.

1
Ensembl ENSG00000136936 (version 109)
Entrez gene 7507
HGNC HGNC:12814
UniProt P23025
GeneCards XPA
INTERACTIONi

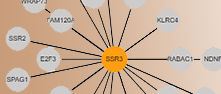
In the Interaction resource network plots showing the gene's first-level interaction partners according to five different datasets are displayed, including a consensus network plot showing only interactions present in at least two of the datasets and an aggregated network displaying interaction from all datasets.Dashed line edges represent interaction pairs only predicted by the deep learning model RosettaFold2-PPI. By clicking on nodes the network can be expanded. In the network plots the nodes represent genes and edge color represent the number of datasets the interaction belongs to. In-house generated AlphaFold 3 predicted 3D structures for interactions in the consensus network are displayed by clicking on the blue symbols on the edges. A blue square on the edge indicate a known heterodimer based on data in the ComplexPortal.

The highlight bar in the top of the plot can be used to color the nodes according to subcellular location (based on data in the Subcellular section), predicted location (based on signalpeptide and transmembrane region predictions), tissue specificity (based on RNA tissue expression profiles), single cell cluster or proteinclass. For genes categorised as single cell type or group specific the option to highlight interaction partners expressed in the same cell type will also be available in the highlight bar.

Custom highlighting of nodes is possible using the top left Filter option in which a query of choice can be built to for example label all nodes that are tissue enriched in both human and mouse brain or those that belongs to a certain tissue expression cluster. The expression cluster for the gene is stated in the box Human Protein Atlas Information above the network plot. Click on Filter in the top left in the plot to find the query builder and some example queries.

Experimentally verified interactions included are direct interaction and physical associations with high and medium confidence from IntAct, physical multivalidated interactions from BioGRID, interactions with>75% probability from BioPlex and significant physical interactions from OpenCell. High precision predicted interactions based on the deep learning model RosettaFold2-PPI are also presented.

Highlight:
Off
Subcell location
Predicted location
Cell type specificity
Cell type cluster
Protein class
Filter menu »
Fields »
e.g. Brain enriched, Localized to mitochondria, Non-specific - Signal transduction

Field
Term
Gene name
Class
Subclass
Category
Keyword
Chromosome
External id
Tissue
Cell type
Expression
Antibody panel
Tissue
Main location
Patient ID
Annotation
Tissue
Category
Tau score
Tissue
Category
Tau score
Tissue
Category
Tau score
Cluster
Reliability
Region
Niche
Category
Brain region
Category
Tau score
Brain domain
Category
Tau score
Cell type
Category
Tau score
Cell type
Category
Tau score
Brain region
Category
Tau score
Brain region
Category
Tau score
Brain region
Category
Tau score
Brain region
Category
Tau score
Cluster
Reliability
Cell type
Category
Tau score
Cell type group
Category
Tau score
Single cell
Category
Tau score
Single cell
Category
Tau score
Annotation
Annotation
Annotation
Tissue
Cell type
Enrichment
Cluster
Cell type
Category
Tau score
Cell lineage
Category
Tau score
Cluster
Location
Searches
Location
Cell line
Class
Type
Phase
Reliability
Cancer
Prognosis
Cancer
Regulation
Cancer
Regulation
Cancer
Category
Cancer
Category
Tau score
Correlation
Cancer
Category
Tau score
Cluster
Variants
Source
PTM
ipTM
Interacting gene (ensg_id)
Type
Number of interactions
Type
Heterodimer
Subsystem
Isoforms
Specificity
Expression
Species
Ortholog
Type
Species
Tissue
Category
Species
Tau score
Data
Category
Data
Species
Category
Category
Category
Category
Category
Validation
Validation
Validation
Validation
Antibodies
Data type
Column


Consensus
Aggregated
IntAct
BioGrid
OpenCell
BioPlex
Rosettafold2-PPI

Non-commercial use only, subject to AlphaFold3 Output Terms of Use

Interaction:
Color scheme:
Confidence
Antibodies
Interactor
Show surface:
Off
On
Autorotate:
Off
On
PAE plot
Number of interactions: 3
Interaction# Consensus# Aggregated# IntAct# BioGrid# OpenCell# BioPlex# Rosettafold2-PPI
ERCC1421915203
HERC29886730200
RPA211394163852010
Number of interactions: 38
Interaction# Consensus# Aggregated# IntAct# BioGrid# OpenCell# BioPlex# Rosettafold2-PPI
ARID3A0271017001
ATR461757100
CDC715421161703
CDK714656471799
CEP16411348202
CETN27448142188
DDB214554441232
DVL3513712421022
ERCC1421915203
ERCC31070152533811
ERCC4424516218
ERCC6070361007
GTF2H47298150137
HERC29886730200
HNRNPCL1231570196
JMJD1C11319103
KPNA3148333392834
KPNA6166019372241
NDEL115776328301
PCNA281743715210147
PICK1831528536095
POLR1C3414588474706
PSMB143141846343209
RMDN101203252
RPA1743910435116
RPA211394163852010
RPA343256322114
RPA431638093
SIRT118161491310171
SKIL2271810101
SNPH0521200
SNX34413144232
TBC1D7432238412
TRIM271527823563000
VPS26C9261297130
XAB214581233112113
XPC843434784
ZNF655112711745011
Show allShow less
Number of interactions: 17 View all protein interaction data in IntAct
Interaction# Consensus# Aggregated# IntAct# BioGrid# OpenCell# BioPlex# Rosettafold2-PPI
ARID3A0271017001
DVL3513712421022
ERCC1421915203
HERC29886730200
NDEL115776328301
PICK1831528536095
POLR1C3414588474706
PSMB143141846343209
RPA211394163852010
SIRT118161491310171
SKIL2271810101
SNPH0521200
TBC1D7432238412
TRIM271527823563000
VPS26C9261297130
XAB214581233112113
ZNF655112711745011
Show allShow less
Number of interactions: 16
Interaction# Consensus# Aggregated# IntAct# BioGrid# OpenCell# BioPlex# Rosettafold2-PPI
ATR461757100
CEP16411348202
DDB214554441232
ERCC1421915203
ERCC4424516218
ERCC6070361007
HERC29886730200
KPNA3148333392834
KPNA6166019372241
PCNA281743715210147
RPA1743910435116
RPA211394163852010
RPA343256322114
RPA431638093
XAB214581233112113
XPC843434784
Show allShow less
Number of interactions: 2
Interaction# Consensus# Aggregated# IntAct# BioGrid# OpenCell# BioPlex# Rosettafold2-PPI
CDC715421161703
CDK714656471799
Number of interactions: 4
Interaction# Consensus# Aggregated# IntAct# BioGrid# OpenCell# BioPlex# Rosettafold2-PPI
HERC29886730200
HNRNPCL1231570196
RMDN101203252
SNX34413144232
Number of interactions: 5
Interaction# Consensus# Aggregated# IntAct# BioGrid# OpenCell# BioPlex# Rosettafold2-PPI
CETN27448142188
ERCC31070152533811
ERCC4424516218
GTF2H47298150137
JMJD1C11319103
PROTEIN INFORMATIONi

The protein information section displays alternative protein-coding transcripts (splice variants) encoded by this gene according to the Ensembl database.

The Splice variant identifier links to the Ensembl website protein summary for the selected splice variant. The data in the Swissprot and TrEMBL columns links to corresponding pages in the UniProt database.

The protein classes assigned to this protein are shown if expanding the data in the protein class column. Parent protein classes are in bold font and subclasses are listed under the parent class.

The length of the protein (amino acid residues according to Ensembl), molecular mass (kDalton), predicted signal peptide and number of predicted transmembrane region(s) according to in-house majority decision methods based on sets of predictors are also reported.

Splice variant SwissProt TrEMBL Protein class Length & mass Signal peptide
(predicted)
Transmembrane regions
(predicted)
XPA-201 P23025
Housekeeping proteins
Predicted intracellular proteins
Cancer-related genes
Disease related genes
Human disease related genes
Mapped to neXtProt
Protein evidence (Kim et al 2014)
Protein evidence (Ezkurdia et al 2014)
Show all
273 aa
31.4 kDa
No 0

Contact

  • NEWS ARTICLES
  • PRESS ROOM

The Project

  • INTRODUCTION
  • ORGANIZATION
  • PUBLICATIONS

The Human Protein Atlas

  • DOWNLOADABLE DATA
  • LICENCE & CITATION
  • HELP & FAQ
KAW logo The Human Protein Atlas project is funded
by the Knut and Alice Wallenberg Foundation.

Facebook logo X logo Bluesky logo Linkedin logo RSS feed logo contact@proteinatlas.org
GCBR logo Elixir core logo SciLifeLab logo Uppsala university logo KI logo KTH logo
We use cookies to enhance the usability of our website. If you continue, we'll assume that you are happy to receive all cookies. More information. Don't show this again.