TFRC
Search result
|
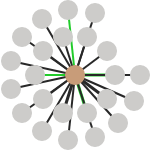
INTERACTION
INTERACTION
METABOLIC
PATHWAYS

Protein interactions
Protein interactions
Methods
Human metabolism
Metabolic proteins
Methods
|
|
||||||||||||||||||||||||||||||||||||||||||||||||||||||||||||||||||||||||||||||||||||||||||||||||||||||||||||||||||||||||||||||||||||||
 The Human Protein Atlas project is funded