SAR1B
HPA
RESOURCES
  • TISSUE
  • BRAIN
  • SINGLE CELL
  • IMMUNE CELL
  • SUBCELLULAR
  • CANCER
  • BLOOD
  • CELL LINE
  • STRUCTURE
  • INTERACTION
  • METABOLIC
  • ISOFORM
  • EVOLUTIONARY
ABOUT
  • INTRODUCTION
  • HISTORY
  • ORGANIZATION
  • PUBLICATIONS
  • ACKNOWLEDGMENTS
  • CONTACT
NEWS
  • NEWS ARTICLES
  • PRESS ROOM
LEARN
  • DICTIONARY
  • PROTEIN CLASSES
  • PROTEIN EVIDENCE
  • METHODS
  • AI IMPLEMENTATIONS
  • EDUCATIONAL VIDEOS
DATA
  • DOWNLOADABLE DATA
  • PUBLICATION DATA
  • RELEASE HISTORY
HELP
  • HELP & FAQ
  • ANTIBODY AVAILABILITY
  • DISCLAIMER
  • PRIVACY STATEMENT
  • LICENCE & CITATION
Fields »
Search result

Field
Term
Gene name
Class
Subclass
Category
Keyword
Chromosome
External id
Tissue
Cell type
Expression
Antibody panel
Tissue
Main location
Patient ID
Annotation
Tissue
Category
Tau score
Tissue
Category
Tau score
Tissue
Category
Tau score
Cluster
Reliability
Region
Niche
Category
Brain region
Category
Tau score
Brain domain
Category
Tau score
Cell type
Category
Tau score
Cell type
Category
Tau score
Brain region
Category
Tau score
Brain region
Category
Tau score
Brain region
Category
Tau score
Brain region
Category
Tau score
Cluster
Reliability
Cell type
Category
Tau score
Cell type group
Category
Tau score
Single cell
Category
Tau score
Single cell
Category
Tau score
Annotation
Annotation
Annotation
Tissue
Cell type
Enrichment
Cluster
Cell type
Category
Tau score
Cell lineage
Category
Tau score
Cluster
Location
Searches
Location
Cell line
Class
Type
Phase
Reliability
Cancer
Prognosis
Cancer
Regulation
Cancer
Regulation
Cancer
Category
Cancer
Category
Tau score
Correlation
Cancer
Category
Tau score
Cluster
Variants
Source
PTM
ipTM
Interacting gene (ensg_id)
Type
Number of interactions
Type
Heterodimer
Subsystem
Isoforms
Specificity
Expression
Species
Ortholog
Type
Species
Tissue
Category
Species
Tau score
Data
Category
Data
Species
Category
Category
Category
Category
Category
Validation
Validation
Validation
Validation
Antibodies
Data type
Column


BETA
  • SUMMARY

  • TISSUE

  • BRAIN

  • SINGLE CELL

  • IMMUNE

  • SUBCELL

  • CANCER

  • BLOOD

  • CELL LINE

  • STRUCTURE

  • INTERACTION

  • METABOLIC

  • ISOFORM

  • EVOLUTION

  • SAR1B
Protein interactions
Interaction methods
GENERAL INFORMATIONi

General description of the gene and the encoded protein(s) using information from HGNC and Ensembl, as well as predictions made by the Human Protein Atlas project.

Gene namei

Official gene symbol, which is typically a short form of the gene name, according to HGNC.

SAR1B
Synonyms SARA2
Gene descriptioni

Full gene name according to HGNC.

Secretion associated Ras related GTPase 1B
Protein classi

Assigned HPA protein class(es) for the encoded protein(s).

Disease related genes
Housekeeping proteins
Human disease related genes
Plasma proteins
Predicted locationi

All transcripts of all genes have been analyzed regarding the location(s) of corresponding protein based on prediction methods for signal peptides and transmembrane regions.

  • Genes with at least one transcript predicted to encode a secreted protein, according to prediction methods or to UniProt location data, have been further annotated and classified with the aim to determine if the corresponding protein(s) are secreted or actually retained in intracellular locations or membrane-attached.
  • Remaining genes, with no transcript predicted to encode a secreted protein, will be assigned the prediction-based location(s).

The annotated location overrules the predicted location, so that a gene encoding a predicted secreted protein that has been annotated as intracellular will have intracellular as the final location.

Intracellular
Protein evidence Evidence at protein level (all genes)

HUMAN PROTEIN ATLAS INFORMATIONi

Summary of RNA expression analysis and annotation data generated within the Human Protein Atlas project.

Single cell type
expression clusteri

The RNA data was used to cluster genes according to their expression across single cell types. Clusters contain genes that have similar expression patterns, and each cluster has been manually annotated to describe common features in terms of function and specificity.

Early spermatids - Flagellar development (mainly)
Single cell type specificityi

The RNA specificity category is based on mRNA expression levels in the analyzed cell types based on scRNA-seq data from normal tissues. The categories include: cell type enriched, group enriched, cell type enhanced, low cell type specificity and not detected.

Low cell type specificity
Tissue expression
cluster (RNA)i

The RNA data was used to cluster genes according to their expression across tissues. Clusters contain genes that have similar expression patterns, and each cluster has been manually annotated to describe common features in terms of function and specificity.

Non-specific - Metabolism (mainly)
Tissue specificity (RNA)i

The RNA specificity category is based on mRNA expression levels in the consensus dataset which is calculated from the RNA expression levels in samples from HPA and GTEX. The categories include: tissue enriched, group enriched, tissue enhanced, low tissue specificity and not detected.

Low tissue specificity
Subcellular locationi

Main subcellular location based on data generated in the subcellular section of the Human Protein Atlas.

Localized to the Endoplasmic reticulum
Secretome annotationi

All genes with at least one predicted secreted isoform have been annotated and classified with the aim to determine if the corresponding protein(s) are:

  • secreted into blood
  • locally secreted
  • or actually being attached to membrane or retained in intracellular locations like mitochondria, endoplasmatic reticulum (ER), Golgi apparatus or lysosomes.
Not available
GENE INFORMATIONi

Gene information from Ensembl and Entrez, as well as links to available gene identifiers are displayed here. Information was retrieved from Ensembl if not indicated otherwise.

Chromosome 5
Cytoband q31.1
Chromosome location (bp) 134601149 - 134649271
Number of transcriptsi

Number of protein-coding transcripts from the gene as defined by Ensembl.

8
Ensembl ENSG00000152700 (version 109)
Entrez gene 51128
HGNC HGNC:10535
UniProt Q9Y6B6
GeneCards SAR1B
INTERACTIONi

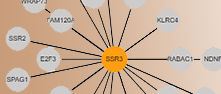
In the Interaction resource network plots showing the gene's first-level interaction partners according to five different datasets are displayed, including a consensus network plot showing only interactions present in at least two of the datasets and an aggregated network displaying interaction from all datasets.Dashed line edges represent interaction pairs only predicted by the deep learning model RosettaFold2-PPI. By clicking on nodes the network can be expanded. In the network plots the nodes represent genes and edge color represent the number of datasets the interaction belongs to. In-house generated AlphaFold 3 predicted 3D structures for interactions in the consensus network are displayed by clicking on the blue symbols on the edges. A blue square on the edge indicate a known heterodimer based on data in the ComplexPortal.

The highlight bar in the top of the plot can be used to color the nodes according to subcellular location (based on data in the Subcellular section), predicted location (based on signalpeptide and transmembrane region predictions), tissue specificity (based on RNA tissue expression profiles), single cell cluster or proteinclass. For genes categorised as single cell type or group specific the option to highlight interaction partners expressed in the same cell type will also be available in the highlight bar.

Custom highlighting of nodes is possible using the top left Filter option in which a query of choice can be built to for example label all nodes that are tissue enriched in both human and mouse brain or those that belongs to a certain tissue expression cluster. The expression cluster for the gene is stated in the box Human Protein Atlas Information above the network plot. Click on Filter in the top left in the plot to find the query builder and some example queries.

Experimentally verified interactions included are direct interaction and physical associations with high and medium confidence from IntAct, physical multivalidated interactions from BioGRID, interactions with>75% probability from BioPlex and significant physical interactions from OpenCell. High precision predicted interactions based on the deep learning model RosettaFold2-PPI are also presented.

Highlight:
Off
Subcell location
Predicted location
Cell type specificity
Cell type cluster
Protein class
Filter menu »
Fields »
e.g. Brain enriched, Localized to mitochondria, Non-specific - Metabolism

Field
Term
Gene name
Class
Subclass
Category
Keyword
Chromosome
External id
Tissue
Cell type
Expression
Antibody panel
Tissue
Main location
Patient ID
Annotation
Tissue
Category
Tau score
Tissue
Category
Tau score
Tissue
Category
Tau score
Cluster
Reliability
Region
Niche
Category
Brain region
Category
Tau score
Brain domain
Category
Tau score
Cell type
Category
Tau score
Cell type
Category
Tau score
Brain region
Category
Tau score
Brain region
Category
Tau score
Brain region
Category
Tau score
Brain region
Category
Tau score
Cluster
Reliability
Cell type
Category
Tau score
Cell type group
Category
Tau score
Single cell
Category
Tau score
Single cell
Category
Tau score
Annotation
Annotation
Annotation
Tissue
Cell type
Enrichment
Cluster
Cell type
Category
Tau score
Cell lineage
Category
Tau score
Cluster
Location
Searches
Location
Cell line
Class
Type
Phase
Reliability
Cancer
Prognosis
Cancer
Regulation
Cancer
Regulation
Cancer
Category
Cancer
Category
Tau score
Correlation
Cancer
Category
Tau score
Cluster
Variants
Source
PTM
ipTM
Interacting gene (ensg_id)
Type
Number of interactions
Type
Heterodimer
Subsystem
Isoforms
Specificity
Expression
Species
Ortholog
Type
Species
Tissue
Category
Species
Tau score
Data
Category
Data
Species
Category
Category
Category
Category
Category
Validation
Validation
Validation
Validation
Antibodies
Data type
Column


Consensus
Aggregated
IntAct
BioGrid
OpenCell
BioPlex
Rosettafold2-PPI

Non-commercial use only, subject to AlphaFold3 Output Terms of Use

Interaction:
Color scheme:
Confidence
Antibodies
Interactor
Show surface:
Off
On
Autorotate:
Off
On
PAE plot
Number of interactions: 3
Interaction# Consensus# Aggregated# IntAct# BioGrid# OpenCell# BioPlex# Rosettafold2-PPI
GAPDH8153291211211
PDCD6IP13501641903
SAR1A175665025
Number of interactions: 144
Interaction# Consensus# Aggregated# IntAct# BioGrid# OpenCell# BioPlex# Rosettafold2-PPI
ABHD14B0201100
ACADM014021101
ACADSB0604110
ACLY139034510
ACOT701485100
ACTN14832657705
ACTN26877020911
ADSL0706100
AGPS114111301
AK10804202
AK201878201
AKR1A101031240
ALDOC1632112
ANP32A225515604
ANP32B3291017700
APEH0622200
ASNS014211100
ATIC0814300
ATP5PO6611835684
BZW11925201
BZW221317511
CALU123022200
CARHSP1013120100
CCR122325302244
CDK111154191346018
CFAP29801210911
CIDEB064590033
CLIC41714102
COPS7A12493432145
CPVL23701611102
CUL339780457732010
CYS1012000120
DBNL23512131103
DHFR050132440
EIF4H21235405
ERMAP0740030
ERP44126461341
ESD215141101
ETF141338405
FABP501105114
FARSB11138111
FASN163646940
FKBP47511145513
FLNA51112191602
G6PD121115600
GANAB127024400
GAPDH8153291211211
GATD3024122100
GCA11292111
GFM1327123341
GLO10714200
GLOD40604200
GMPS012011101
GSTM531053164
HINT1018017100
HNRNPK29167531322100
HPRT1119107302
HSD17B12141525840
HSP90B181076831674
HSPA41617951325458
IDH102199202
IL1R2024210174
JPT101053200
JPT20201100
LAP301585200
LTA4H0411200
MAT2A2311417211
MDH101739500
METTL7A11574230
MPI0302100
MTHFD1021016410
NAE141758272
NAMPT1937110
NME1-NME20703400
OLA1013111100
P4HB4964148831
PAFAH1B1175317382022
PAICS234920601
PARK72652150100
PDCD67331221913
PDCD6IP13501641903
PDIA44798592140
PGAM2338446283
PGM1017114200
PHPT10310101
PINK11416316650990
PLOD211118400
PPA1019015203
PPA201109201
PPIA2951182320
PPM1G16774394374
PRDX21566344124
PRDX5115411100
PREB2300104162
PRMT311637170
PSAT111858600
PSMB5236817551889
PSMD13356120543906
PSME121508382791
PYGL31227520
RANBP321237301
RASL11A013200102
RCN10442114900
RMDN101203252
RNPEP0502300
S100A1101155110
SAR1A175665025
SARS1225187111
SEC23A104425191115
SEC23B5321216836
SEC31B0801007
SNX26451723965
SPIN1120161140
SUCLA2025717102
TARS1117413100
TBCB118382010
TCP123151119819578
TKT024121102
TLN15415252515
TMED10181308251012011
TMED2155971837197
TMEM14B11931931002
TNPO18557312700
TPD52L2120315203
TUBA802317357
TXNDC1201883106
UBA24193132210
UBA331185203
UBA6129122160
UBE2C018212104
UBE2N158726662027
UBQLN12425321463500
UCHL14602934101
UFC151156332
UFM1320651113
USP14880178901
VAT1011010100
VCP56390563564350
VDAC1811015832220
VPS28631131010101
WDR1237227509
XRCC5111561813913210
YTHDF127913390263
YWHAE2305491243903241211
Show allShow less
Number of interactions: 3 View all protein interaction data in IntAct
Interaction# Consensus# Aggregated# IntAct# BioGrid# OpenCell# BioPlex# Rosettafold2-PPI
CIDEB064590033
SAR1A175665025
TMEM14B11931931002
Number of interactions: 3
Interaction# Consensus# Aggregated# IntAct# BioGrid# OpenCell# BioPlex# Rosettafold2-PPI
GAPDH8153291211211
PDCD6IP13501641903
SAR1A175665025
Number of interactions: 126
Interaction# Consensus# Aggregated# IntAct# BioGrid# OpenCell# BioPlex# Rosettafold2-PPI
ABHD14B0201100
ACADM014021101
ACADSB0604110
ACLY139034510
ACOT701485100
ACTN14832657705
ACTN26877020911
ADSL0706100
AGPS114111301
AK10804202
AK201878201
AKR1A101031240
ALDOC1632112
ANP32A225515604
ANP32B3291017700
APEH0622200
ASNS014211100
ATIC0814300
ATP5PO6611835684
BZW11925201
BZW221317511
CALU123022200
CARHSP1013120100
CDK111154191346018
CFAP29801210911
CLIC41714102
COPS7A12493432145
CPVL23701611102
CUL339780457732010
DBNL23512131103
DHFR050132440
EIF4H21235405
ERP44126461341
ESD215141101
ETF141338405
FABP501105114
FARSB11138111
FASN163646940
FKBP47511145513
FLNA51112191602
G6PD121115600
GANAB127024400
GAPDH8153291211211
GATD3024122100
GCA11292111
GFM1327123341
GLO10714200
GLOD40604200
GMPS012011101
GSTM531053164
HINT1018017100
HNRNPK29167531322100
HPRT1119107302
HSD17B12141525840
HSP90B181076831674
HSPA41617951325458
IDH102199202
JPT101053200
JPT20201100
LAP301585200
LTA4H0411200
MAT2A2311417211
MDH101739500
MPI0302100
MTHFD1021016410
NAE141758272
NAMPT1937110
NME1-NME20703400
OLA1013111100
P4HB4964148831
PAFAH1B1175317382022
PAICS234920601
PARK72652150100
PDCD6IP13501641903
PDIA44798592140
PGAM2338446283
PGM1017114200
PHPT10310101
PLOD211118400
PPA1019015203
PPA201109201
PPIA2951182320
PPM1G16774394374
PRDX21566344124
PRDX5115411100
PRMT311637170
PSAT111858600
PSMB5236817551889
PSMD13356120543906
PSME121508382791
PYGL31227520
RANBP321237301
RCN10442114900
RMDN101203252
RNPEP0502300
S100A1101155110
SARS1225187111
SNX26451723965
SUCLA2025717102
TARS1117413100
TBCB118382010
TCP123151119819578
TKT024121102
TLN15415252515
TMED10181308251012011
TMED2155971837197
TNPO18557312700
TPD52L2120315203
TUBA802317357
TXNDC1201883106
UBA24193132210
UBA331185203
UBA6129122160
UBE2C018212104
UBE2N158726662027
UBQLN12425321463500
UCHL14602934101
UFC151156332
UFM1320651113
USP14880178901
VAT1011010100
VCP56390563564350
VDAC1811015832220
WDR1237227509
XRCC5111561813913210
YWHAE2305491243903241211
Show allShow less
Number of interactions: 11
Interaction# Consensus# Aggregated# IntAct# BioGrid# OpenCell# BioPlex# Rosettafold2-PPI
CCR122325302244
CYS1012000120
ERMAP0740030
IL1R2024210174
METTL7A11574230
PINK11416316650990
RASL11A013200102
SAR1A175665025
SPIN1120161140
VPS28631131010101
YTHDF127913390263
Show allShow less
Number of interactions: 5
Interaction# Consensus# Aggregated# IntAct# BioGrid# OpenCell# BioPlex# Rosettafold2-PPI
PDCD67331221913
PREB2300104162
SEC23A104425191115
SEC23B5321216836
SEC31B0801007
PROTEIN INFORMATIONi

The protein information section displays alternative protein-coding transcripts (splice variants) encoded by this gene according to the Ensembl database.

The Splice variant identifier links to the Ensembl website protein summary for the selected splice variant. The data in the Swissprot and TrEMBL columns links to corresponding pages in the UniProt database.

The protein classes assigned to this protein are shown if expanding the data in the protein class column. Parent protein classes are in bold font and subclasses are listed under the parent class.

The length of the protein (amino acid residues according to Ensembl), molecular mass (kDalton), predicted signal peptide and number of predicted transmembrane region(s) according to in-house majority decision methods based on sets of predictors are also reported.

Splice variant SwissProt TrEMBL Protein class Length & mass Signal peptide
(predicted)
Transmembrane regions
(predicted)
SAR1B-201 Q9Y6B6
Housekeeping proteins
Predicted intracellular proteins
Plasma proteins
Disease related genes
Human disease related genes
Mapped to neXtProt
Protein evidence (Kim et al 2014)
Protein evidence (Ezkurdia et al 2014)
Show all
198 aa
22.4 kDa
No 0
SAR1B-202 Q9Y6B6
Housekeeping proteins
Predicted intracellular proteins
Plasma proteins
Disease related genes
Human disease related genes
Mapped to neXtProt
Protein evidence (Ezkurdia et al 2014)
Show all
198 aa
22.4 kDa
No 0
SAR1B-203 D6RAA2
Housekeeping proteins
Predicted intracellular proteins
Human disease related genes
Protein evidence (Ezkurdia et al 2014)
103 aa
11.5 kDa
No 0
SAR1B-204 Q9H029
Housekeeping proteins
Predicted intracellular proteins
Human disease related genes
Protein evidence (Ezkurdia et al 2014)
130 aa
14.8 kDa
No 0
SAR1B-207 D6RD69
Housekeeping proteins
Predicted intracellular proteins
Human disease related genes
Protein evidence (Ezkurdia et al 2014)
170 aa
19 kDa
No 0
SAR1B-208 Q9H029
Housekeeping proteins
Predicted intracellular proteins
Human disease related genes
Protein evidence (Ezkurdia et al 2014)
130 aa
14.8 kDa
No 0
SAR1B-210 D6R9R5
Housekeeping proteins
Predicted intracellular proteins
Human disease related genes
Protein evidence (Ezkurdia et al 2014)
118 aa
13.4 kDa
No 0
SAR1B-211 Q9H029
Housekeeping proteins
Predicted intracellular proteins
Human disease related genes
Protein evidence (Ezkurdia et al 2014)
130 aa
14.8 kDa
No 0
Show allShow less

Contact

  • NEWS ARTICLES
  • PRESS ROOM

The Project

  • INTRODUCTION
  • ORGANIZATION
  • PUBLICATIONS

The Human Protein Atlas

  • DOWNLOADABLE DATA
  • LICENCE & CITATION
  • HELP & FAQ
KAW logo The Human Protein Atlas project is funded
by the Knut and Alice Wallenberg Foundation.

Facebook logo X logo Bluesky logo Linkedin logo RSS feed logo contact@proteinatlas.org
GCBR logo Elixir core logo SciLifeLab logo Uppsala university logo KI logo KTH logo
We use cookies to enhance the usability of our website. If you continue, we'll assume that you are happy to receive all cookies. More information. Don't show this again.