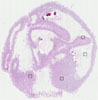
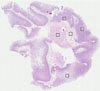
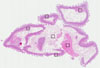
On the top, protein expression in current human tissue, based on all annotated cell types, is reported with the units not detected (n), low (l), medium (m) and high (h). Underneath, protein expression in each annotated cell type are reported using the same units. Protein expression data is based on knowledge-based annotation. For genes where more than one antibody has been used, a collective score is set. If knowledge-based annotation could not be performed for a gene, no data is displayed here. View antibody staining data further down this page.
h
m
l
n
Endocrine cells:
High
Enterocytes:
High
Enterocytes - Microvilli:
Not detected
Goblet cells:
High
Paneth cells:
High
RNA expressioni
A summary of mRNA expression data available for current tissue based on several datasets. The mRNA expression levels in human tissues are based on RNA-seq data generated by the Human Protein Atlas HPA, Genotype-Tissue Expression GTEx portal and CAGE data generated by the FANTOM5 consortium. Consensus normalized expression levels for human tissues was created by combining the data from HPA and GTEx datasets. The mRNA expression levels in pig brain are based on RNA-seq data generated by the Human Protein Atlas, and for mouse brain HPA data and in situ hybridization generated by the Allen brain atlas dataset are reported.
Scroll down to view mRNA expression data in more detail.
Antibody staining in the annotated cell types in the current human tissue is reported as not detected, low, medium, or high, based on conventional immunohistochemistry profiling in selected tissues. This score is based on the combination of the staining intensity and fraction of stained cells. Each image is clickable and will lead to virtual microscopy that enables deeper exploration of all samples and also displays staining intensity scores, fraction scores and subcellular localization as well as patient and tissue information for each sample.
Ascending and descending describe two types of gradient, based on difference in staining intensity between enterocytes in crypts and apical enterocytes.
Ascending - the staining intensity is stronger in apical enterocytes (towards the lumen) compared to enterocytes in the crypts (gland based)
Descending - the staining is weaker in apical enterocytes compared to enterocytes in crypts
Antibody HPA036048
Antibody CAB002427
Endocrine cells
-
High
Enterocytes
-
High
Enterocytes - Microvilli
-
Not detected
Glandular cells
Low
-
Goblet cells
-
High
Paneth cells
-
High
SMALL INTESTINE - PROTEINTALKS DB MS
Median intensity
28008
Sample
Intensity
Small intestine_01
25361
Small intestine_02
33664
Small intestine_03
31927
Small intestine_04
40776
Small intestine_05
19548
Small intestine_06
27874
Small intestine_07
28142
Small intestine_08
22422
SMALL INTESTINE - HPA RNA-seqi
The RNA-seq details section shows detailed information about the individual samples used for the transcript profiling and results of the RNA-seq analysis.
Information about each individual sample is listed below, including gender, age, a tissue section image and estimated fractions of cell types. nTPM (normalized transcripts per million) values give a quantification of the gene abundance which is comparable between different genes and samples.
Average nTPMi
Max subtype nTPM is the value for the subtype with the largest average nTPM across the subtype samples.
200.4
Male, age 65
Small intestine sample 232 nTPM: 200.1
Cell types%
Glandular cells:
55
Smooth muscle cells:
5
Other cell types:
40
Male, age 39
Small intestine sample 233 nTPM: 236.3
Cell types%
Glandular cells:
40
Smooth muscle cells:
5
Other cell types:
55
Male, age 68
Small intestine sample 234 nTPM: 183.2
Cell types%
Glandular cells:
30
Smooth muscle cells:
15
Other cell types:
55
Male, age 85
Small intestine sample 235 nTPM: 181.9
SMALL INTESTINE - GTEx RNA-seqi
RNA-Seq data generated by the Genotype-Tissue Expression (GTEx) project from human tissues is reported as mean nTPM. More information can be found on the GTEx portal.
Distribution across the dataset is visualized with box plots, shown as median and 25th and 75th percentiles. Points are displayed as outliers if they are above or below 1.5 times the interquartile range. nTPM values of the individual samples are presented next to the box plot.
Max subtype nTPMi
Max subtype nTPM is the value for the subtype with the largest average nTPM across the subtype samples.
242.7
GTEx sample id
Sample description
nTPM
Small Intestine - Terminal Ileum Average nTPM: 242.7
Samples: 207
Max nTPM: 554.0
Min nTPM: 96.6
Std nTPM: 78.7
Median nTPM: 239.0
GTEX-111YS-1426-SM-5GID8
60-69 years, male
554.0
GTEX-XPVG-1726-SM-4B65W
50-59 years, male
509.8
GTEX-YEC4-1726-SM-4W21E
40-49 years, male
467.8
GTEX-1OKEX-1126-SM-DTXEB
60-69 years, male
442.5
GTEX-1LH75-1926-SM-DIPGD
50-59 years, female
436.1
GTEX-Y5V5-1826-SM-4VDS5
60-69 years, female
423.1
GTEX-1HBPN-1926-SM-GA91H
50-59 years, male
406.4
GTEX-Y5LM-1626-SM-4VDTB
40-49 years, female
401.0
GTEX-14PJ6-1726-SM-6AJBN
60-69 years, female
378.9
GTEX-XPT6-1026-SM-GOQYN
20-29 years, male
368.4
GTEX-111CU-1326-SM-5NQ8L
50-59 years, male
368.2
GTEX-WYJK-1526-SM-4ONCW
50-59 years, male
367.1
GTEX-1I1GT-1826-SM-ARZLW
60-69 years, female
364.8
GTEX-WY7C-1826-SM-4ONCE
50-59 years, male
362.2
GTEX-ZAB5-1526-SM-5HL9P
50-59 years, male
361.1
GTEX-13X6H-1826-SM-5O9D1
50-59 years, female
356.2
GTEX-YFCO-1326-SM-664NV
40-49 years, male
350.7
GTEX-X5EB-1626-SM-4E3IV
40-49 years, male
345.0
GTEX-117YX-0326-SM-5GICL
50-59 years, male
344.1
GTEX-1S82Z-1826-SM-E9TIK
30-39 years, female
343.1
GTEX-WFON-1526-SM-4LVMP
40-49 years, male
342.6
GTEX-13D11-0726-SM-5LZZB
50-59 years, female
341.9
GTEX-YB5E-1526-SM-5IFIE
40-49 years, male
337.4
GTEX-14DAR-1426-SM-5RQIR
50-59 years, male
336.2
GTEX-ZPCL-1726-SM-57WEO
60-69 years, female
333.9
GTEX-1GMR2-1026-SM-7MKHJ
50-59 years, male
333.0
GTEX-11LCK-1926-SM-5A5KE
30-39 years, male
330.8
GTEX-YF7O-1826-SM-5IFIU
50-59 years, male
325.5
GTEX-1QP2A-2426-SM-EXOJA
50-59 years, male
322.8
GTEX-ZLV1-1126-SM-4WWBW
60-69 years, female
321.4
GTEX-ZPU1-1826-SM-GNTB3
40-49 years, male
320.1
GTEX-ZYFG-2026-SM-5E43Y
60-69 years, female
316.1
GTEX-1192X-2526-SM-59868
50-59 years, male
313.4
GTEX-14PJN-0826-SM-686ZL
30-39 years, male
313.2
GTEX-13NYB-1826-SM-5J1N3
40-49 years, male
312.3
GTEX-17KNJ-1626-SM-718AL
50-59 years, male
311.8
GTEX-W5X1-1926-SM-GOQYX
40-49 years, female
309.5
GTEX-ZVZP-1826-SM-5GZXB
50-59 years, male
307.4
GTEX-1122O-1326-SM-5H11F
60-69 years, female
305.9
GTEX-ZV7C-1426-SM-GNTB8
50-59 years, male
302.3
GTEX-YB5K-1126-SM-H6Q6O
40-49 years, female
301.3
GTEX-ZA64-1226-SM-5HL7B
20-29 years, male
300.3
GTEX-ZXES-1526-SM-5NQ95
30-39 years, female
299.8
GTEX-XUZC-1426-SM-4BRV3
30-39 years, female
299.4
GTEX-1J8Q3-2526-SM-CNNQ4
60-69 years, male
299.2
GTEX-1B8KE-1726-SM-7IGMN
50-59 years, male
298.9
GTEX-1QCLZ-2126-SM-EWRNC
60-69 years, female
296.3
GTEX-1CAMS-2426-SM-7DHMV
40-49 years, female
294.4
GTEX-1R9JW-1926-SM-EVR4J
30-39 years, female
294.1
GTEX-1MA7W-0726-SM-HLJQU
20-29 years, female
293.6
GTEX-WQUQ-2426-SM-4MVNW
60-69 years, male
293.1
GTEX-14XAO-1926-SM-6ETZO
60-69 years, female
291.7
GTEX-ZTPG-2626-SM-57WFX
20-29 years, female
291.3
GTEX-1NSGN-2126-SM-DPRYN
50-59 years, male
290.5
GTEX-14PN3-2026-SM-68729
60-69 years, female
289.3
GTEX-14PKV-2026-SM-6AJ9A
20-29 years, female
287.0
GTEX-16AAH-1426-SM-7KFTR
50-59 years, male
286.7
GTEX-Y9LG-1626-SM-5IFHM
30-39 years, male
285.9
GTEX-XGQ4-1326-SM-4GIDU
50-59 years, male
285.7
GTEX-1S831-1526-SM-HLJQS
20-29 years, male
283.5
GTEX-13FTW-2026-SM-5IJE2
40-49 years, male
282.1
GTEX-ZQUD-0926-SM-57WE3
30-39 years, male
281.7
GTEX-WFG7-1726-SM-4LVME
20-29 years, male
279.8
GTEX-1NHNU-2526-SM-HK79M
50-59 years, male
279.3
GTEX-1399R-2026-SM-5K7WN
30-39 years, male
278.6
GTEX-Y3I4-1326-SM-4TT8Z
50-59 years, male
278.2
GTEX-ZDTT-1726-SM-5HL69
60-69 years, male
278.0
GTEX-ZTX8-0526-SM-59HLD
20-29 years, male
277.2
GTEX-145LT-1026-SM-5LU9O
40-49 years, male
274.7
GTEX-13PL7-2626-SM-5IFH4
60-69 years, female
274.3
GTEX-WFG8-1626-SM-4LVMB
20-29 years, male
274.2
GTEX-XXEK-1026-SM-4BRUW
50-59 years, male
270.1
GTEX-ZF2S-1726-SM-57WFT
50-59 years, female
270.1
GTEX-178AV-1226-SM-GOR11
40-49 years, male
269.1
GTEX-1AMFI-1926-SM-731F2
50-59 years, female
268.1
GTEX-14PJ3-1326-SM-664O7
50-59 years, male
267.6
GTEX-11I78-1126-SM-5A5K5
50-59 years, female
266.5
GTEX-131XF-1326-SM-5GCMQ
60-69 years, male
265.2
GTEX-XBED-1426-SM-4AT4G
60-69 years, male
264.7
GTEX-16MTA-1526-SM-6LPJB
50-59 years, male
263.7
GTEX-15G1A-1726-SM-6LPI4
30-39 years, male
262.0
GTEX-WEY5-1526-SM-4LMJF
40-49 years, female
261.6
GTEX-1QW4Y-1226-SM-EWRMY
30-39 years, male
260.3
GTEX-ZTSS-0926-SM-59865
40-49 years, male
259.6
GTEX-X4LF-1326-SM-HLJSD
50-59 years, male
254.9
GTEX-1KXAM-2026-SM-DHXKI
60-69 years, male
254.2
GTEX-VJYA-0926-SM-4KL1N
60-69 years, male
254.2
GTEX-ZLWG-1626-SM-DNZZ1
50-59 years, female
253.3
GTEX-WHSB-1026-SM-4M1XN
50-59 years, male
251.8
GTEX-16NGA-1126-SM-7KFSY
40-49 years, female
251.4
GTEX-ZPIC-2326-SM-57WDW
40-49 years, female
250.8
GTEX-133LE-1426-SM-5IFH1
20-29 years, female
248.6
GTEX-XMK1-1826-SM-4B66F
40-49 years, male
248.1
GTEX-U8XE-2226-SM-HAUZQ
30-39 years, male
247.5
GTEX-139YR-2226-SM-5IFFW
50-59 years, male
247.3
GTEX-13113-1226-SM-5EGHT
60-69 years, female
247.0
GTEX-ZG7Y-1926-SM-DNZZ5
50-59 years, male
246.1
GTEX-ZT9X-1026-SM-HLJS2
40-49 years, male
245.8
GTEX-11DXX-1626-SM-5H11H
60-69 years, female
244.2
GTEX-11EQ9-1326-SM-5985X
30-39 years, male
243.7
GTEX-13OVI-1926-SM-5IJCG
60-69 years, female
241.6
GTEX-13RTK-0826-SM-5Q5C6
20-29 years, male
239.4
GTEX-Y114-1426-SM-4TT6W
50-59 years, female
239.4
GTEX-YJ8A-2126-SM-GQ1C7
20-29 years, male
239.0
GTEX-1HCUA-1726-SM-GA8Z2
50-59 years, female
238.8
GTEX-11P7K-1626-SM-5GU63
30-39 years, male
237.2
GTEX-Y111-2226-SM-4SOJB
50-59 years, male
236.7
GTEX-144GM-1026-SM-5O9AZ
20-29 years, male
235.8
GTEX-ZF29-1626-SM-4WKFJ
60-69 years, female
235.1
GTEX-14E6E-1626-SM-5RQI7
30-39 years, male
233.4
GTEX-1C64O-2526-SM-79ONO
60-69 years, male
231.5
GTEX-Y3IK-1726-SM-4YCCR
50-59 years, female
231.5
GTEX-1BAJH-2526-SM-7IGOT
70-79 years, male
231.2
GTEX-139T6-1026-SM-5IJGC
50-59 years, male
230.6
GTEX-14PKU-1626-SM-6871C
40-49 years, female
227.1
GTEX-ZQG8-2526-SM-57WEQ
60-69 years, female
225.9
GTEX-18A66-2526-SM-7KFTZ
60-69 years, male
225.4
GTEX-11DXZ-1326-SM-5H11X
50-59 years, male
225.2
GTEX-ZZ64-0526-SM-5GZXM
20-29 years, male
224.3
GTEX-13O21-1026-SM-5IJDU
50-59 years, male
223.9
GTEX-14PK6-1626-SM-6871I
70-79 years, female
218.3
GTEX-1399S-2026-SM-5KM4B
30-39 years, female
216.9
GTEX-13CF3-1226-SM-5LZXN
60-69 years, female
216.5
GTEX-1L5NE-1826-SM-EV79T
50-59 years, male
216.1
GTEX-1R7EV-1226-SM-DTX82
40-49 years, male
215.8
GTEX-13111-1426-SM-5DUW3
50-59 years, male
214.7
GTEX-1PFEY-1326-SM-HK791
30-39 years, male
214.0
GTEX-WHPG-1826-SM-GNTAH
50-59 years, male
212.7
GTEX-12WSK-1526-SM-5CVNO
40-49 years, female
212.3
GTEX-WH7G-1626-SM-4LVMY
40-49 years, male
210.0
GTEX-1JMQK-2426-SM-CXZJU
60-69 years, male
209.3
GTEX-1K9T9-2726-SM-D4P3E
50-59 years, female
206.0
GTEX-1MUQO-2426-SM-EAZ5A
60-69 years, male
205.9
GTEX-1R7EU-1326-SM-E6CQ6
60-69 years, male
205.7
GTEX-X3Y1-1526-SM-H6Q6X
40-49 years, male
204.3
GTEX-ZEX8-1826-SM-57WBH
50-59 years, male
203.8
GTEX-1B8KZ-1126-SM-7IGLX
50-59 years, male
203.2
GTEX-ZVP2-1726-SM-5GU5P
50-59 years, male
202.6
GTEX-1RAZA-1826-SM-DTXA2
20-29 years, male
201.4
GTEX-1CAMR-0826-SM-7MKFK
20-29 years, male
200.0
GTEX-15EU6-1826-SM-7PC1W
50-59 years, male
199.9
GTEX-ZLFU-1526-SM-4WWBT
40-49 years, male
197.3
GTEX-ZVT2-2126-SM-5NQ93
50-59 years, female
196.9
GTEX-11P82-0826-SM-5P9GU
20-29 years, male
196.6
GTEX-1J8QM-1026-SM-C1YQA
60-69 years, female
196.5
GTEX-14C39-1826-SM-5ZZW4
40-49 years, male
195.9
GTEX-XAJ8-0526-SM-47JYK
40-49 years, male
194.2
GTEX-1R9K5-2026-SM-E6CPS
50-59 years, male
193.1
GTEX-1R9PM-1626-SM-DPRY9
20-29 years, male
192.5
GTEX-ZC5H-2326-SM-4WAYT
40-49 years, female
192.5
GTEX-1C475-1426-SM-793CH
40-49 years, female
188.9
GTEX-WFJO-0926-SM-4LVM2
30-39 years, male
188.8
GTEX-WRHK-1026-SM-4MVOD
20-29 years, female
187.7
GTEX-1497J-1926-SM-5TDCC
60-69 years, male
186.2
GTEX-VUSG-1726-SM-4KKZL
50-59 years, male
182.3
GTEX-131XG-1726-SM-5LZUR
50-59 years, female
181.8
GTEX-11NSD-1726-SM-5N9C3
20-29 years, male
177.5
GTEX-1JK1U-1226-SM-CNNPN
60-69 years, male
176.9
GTEX-1S5ZA-1326-SM-EV7BB
20-29 years, male
176.9
GTEX-1JN76-1126-SM-C1YRL
20-29 years, female
173.9
GTEX-Z9EW-0926-SM-5CVMM
40-49 years, male
173.9
GTEX-15DZA-0826-SM-6AJBF
30-39 years, female
172.7
GTEX-ZP4G-1626-SM-57WGD
20-29 years, female
171.1
GTEX-145ME-0926-SM-5O9AR
40-49 years, female
170.4
GTEX-UPK5-2026-SM-4JBIM
40-49 years, male
170.1
GTEX-13QBU-1926-SM-5IJEW
40-49 years, female
168.8
GTEX-13O61-1326-SM-5KM31
60-69 years, male
168.2
GTEX-1RQED-2826-SM-HLJQK
60-69 years, male
168.2
GTEX-1MGNQ-2326-SM-EV7BG
40-49 years, male
165.5
GTEX-X15G-1426-SM-4PQZK
50-59 years, female
165.0
GTEX-1M5QR-2226-SM-HLJRV
40-49 years, male
164.0
GTEX-1MCYP-1626-SM-HLJQ5
20-29 years, female
163.3
GTEX-1QPFJ-2626-SM-DPRZU
30-39 years, female
162.7
GTEX-12BJ1-1926-SM-5HL9Z
60-69 years, male
159.6
GTEX-1IKOE-1926-SM-ARU7V
30-39 years, female
159.6
GTEX-14BMU-1426-SM-5TDE5
20-29 years, female
158.5
GTEX-1PDJ9-1826-SM-E9U66
20-29 years, male
158.1
GTEX-1HSMQ-2226-SM-C1YRD
50-59 years, male
158.0
GTEX-17HHE-1726-SM-79OKT
50-59 years, male
154.8
GTEX-1R9K4-2326-SM-E6CRB
60-69 years, male
154.8
GTEX-1RAZR-1826-SM-E6CRE
40-49 years, male
152.7
GTEX-13FH7-1226-SM-5IJFK
50-59 years, female
151.4
GTEX-16A39-1426-SM-6LLI6
30-39 years, female
151.4
GTEX-11XUK-1426-SM-5EQMG
40-49 years, female
150.6
GTEX-1OJC3-1626-SM-E9U65
20-29 years, male
150.3
GTEX-1HSGN-2126-SM-GA8ZB
40-49 years, female
146.5
GTEX-1H1DE-1426-SM-9JGHV
20-29 years, male
145.4
GTEX-1H11D-2526-SM-9JGGU
40-49 years, male
144.6
GTEX-11VI4-1626-SM-5EQKO
40-49 years, female
138.7
GTEX-1HKZK-2226-SM-GA91V
40-49 years, male
137.9
GTEX-17MFQ-1026-SM-7KFSZ
20-29 years, male
135.8
GTEX-18QFQ-1626-SM-72D7H
30-39 years, male
135.8
GTEX-1PIEJ-1526-SM-E6CP8
20-29 years, female
135.6
GTEX-1LGOU-1426-SM-D3L8N
20-29 years, female
134.3
GTEX-1399U-2126-SM-5IFEZ
50-59 years, female
134.1
GTEX-1AX8Z-2526-SM-731E3
60-69 years, male
133.8
GTEX-148VJ-2226-SM-5NQ9M
70-79 years, male
131.9
GTEX-1QP28-1726-SM-E6CRK
50-59 years, female
124.1
GTEX-1GL5R-2026-SM-7MKHP
50-59 years, male
123.7
GTEX-1LBAC-1526-SM-CXZKU
20-29 years, male
122.2
GTEX-1F75I-2526-SM-9WPOZ
40-49 years, male
121.9
GTEX-183FY-1626-SM-793D8
20-29 years, male
121.3
GTEX-1EMGI-2826-SM-7IGMR
60-69 years, male
121.1
GTEX-1RAZQ-2226-SM-DPRZR
30-39 years, male
119.8
GTEX-11TUW-1926-SM-5BC58
60-69 years, male
118.6
GTEX-1GMR3-2726-SM-7MKFB
40-49 years, male
111.6
GTEX-1JJE9-2226-SM-CXZJM
70-79 years, male
96.6
Show allShow less
SMALL INTESTINE - FANTOM5 CAGEi
RNA expression in human tissues obtained through Cap Analysis of Gene Expression (CAGE) generated by the FANTOM5 project are reported as Scaled Tags Per Million.
Max subtype Scaled Tags Per Millioni
Max subtype Scaled Tags Per Million is the value for the subtype with the largest average Scaled Tags Per Million across the subtype samples.
We use cookies to enhance the usability of our website. If you continue, we'll assume that you are happy to receive all cookies. More information. Don't show this again.


 The Human Protein Atlas project is funded