We use cookies to enhance the usability of our website. If you continue, we'll assume that you are happy to receive all cookies. More information. Don't show this again.
General description of the gene and the encoded protein(s) using information from HGNC and Ensembl, as well as predictions made by the Human Protein Atlas project.
Gene namei
Official gene symbol, which is typically a short form of the gene name, according to HGNC.
Assigned HPA protein class(es) for the encoded protein(s).
Cancer-related genes Enzymes FDA approved drug targets
Predicted locationi
All transcripts of all genes have been analyzed regarding the location(s) of corresponding protein based on prediction methods for signal peptides and transmembrane regions.
Genes with at least one transcript predicted to encode a secreted protein, according to prediction methods or to UniProt location data, have been further annotated and classified with the aim to determine if the corresponding protein(s) are secreted or actually retained in intracellular locations or membrane-attached.
Remaining genes, with no transcript predicted to encode a secreted protein, will be assigned the prediction-based location(s).
The annotated location overrules the predicted location, so that a gene encoding a predicted secreted protein that has been annotated as intracellular will have intracellular as the final location.
Membrane, Intracellular
Number of transcriptsi
Number of protein-coding transcripts from the gene as defined by Ensembl.
12
HUMAN PROTEIN ATLAS INFORMATIONi
Summary of data presented in the Pathology section, with representative images of protein expression in cancer (left) and correlation between mRNA expression and patient survival (right). Images are clickable and redirect to pages with more Pathology data. This section contains mRNA and protein expression data from 17 different forms of human cancer, as well as correlation analysis of mRNA expression and patient survival. The protein expression data is derived from antibody-based protein profiling using immunohistochemistry.
RNA categoryi
A summary of RNA categories for human tissues, cell lines and cancer tissues. Categories for RNA specificity include tissue enriched, group enriched, tissue enhanced, low tissue specificity and not detected. Categories for RNA distribution include detected in single, detected in some, detected in many, detected in all and not detected.
Human tissue RNA category is based on the consensus dataset, which is a combination of RNA data from human tissues from three sources: HPA, GTEX and FANTOM5. Cell line RNA category is based on RNA data from cells lines from HPA dataset. More information can be found about the normalization and classification of these datasets.
Cancer tissue RNA category is based on RNA data from the The Cancer Genome Atlas (TCGA), categorized in the same way as human tissues and cell lines.
Consensus (human tissue):
Low tissue specificity Detected in all
Cell line (cancer):
Low cancer specificity Detected in all
TCGA (cancer tissue):
Low cancer specificity Detected in all
Protein evidencei
Evidence score for genes based on UniProt protein existence (UniProt evidence); neXtProt protein existence (neXtProt evidence);and a Human Protein Atlas antibody- or RNA based score (HPA evidence). The avaliable scores are evidence at protein level, evidence at transcript level, no evidence, or not avaliable.
A summary of the overall protein expression pattern across the analyzed normal tissues. The summary is based on knowledge-based annotation.
"Estimation of protein expression could not be performed. View primary data." is shown for genes analyzed with a knowledge-based approach where available RNA-seq and gene/protein characterization data has been evaluated as not sufficient in combination with immunohistochemistry data to yield a reliable estimation of the protein expression profile.
Mainly cytoplasmic and nuclear expression in several tissues.
IMMUNOHISTOCHEMISTRY DATA RELIABILITY
Data reliability descriptioni
Standardized explanatory sentences with additional information required for full understanding of the protein expression profile, based on knowledge-based and secretome-based annotation.
Medium consistency between antibody staining and RNA expression data. Caution, targets protein from more than one gene.
Reliability score - normal tissuesi
A reliability score is manually set for all genes and indicates the level of reliability of the analyzed protein expression pattern based on available RNA-seq data, protein/gene characterization data and immunohistochemical data from one or several antibodies with non-overlapping epitopes. The reliability score is based on the 44 normal tissues analyzed, and if there is available data from more than one antibody, the staining patterns of all antibodies are taken into consideration during evaluation.
The reliability score is divided into Enhanced, Supported, Approved, or Uncertain, and is displayed on both Tissue Atlas and Pathology Atlas.
Approved
Antibodiesi
Antibodies used for this assay. Click on an antibody for more information.
Kaplan-Meier plots for all cancers where high expression of this gene has significant (p<0.001) association with patient survival are shown in this summary. Whether the prognosis is favorable or unfavorable is indicated in brackets. Each Kaplan-Meier plot is clickable and redirects to a detailed page that includes individual expression and survival data for patients with the selected cancer.
RNA expression overview shows RNA-seq data from The Cancer Genome Atlas (TCGA).
TCGA dataseti
RNA-seq data in 17 cancer types are reported as median FPKM (number Fragments Per Kilobase of exon per Million reads), generated by the The Cancer Genome Atlas (TCGA).
RNA cancer tissue category is calculated based on mRNA expression levels across all 17 cancer tissues and include: cancer tissue enriched, cancer group enriched, cancer tissue enhanced, expressed in all, mixed and not detected.Normal distribution across the dataset is visualized with box plots, shown as median and 25th and 75th percentiles. Points are displayed as outliers if they are above or below 1.5 times the interquartile range. To access cancer specific RNA and prognostic data, click on the cancer name. The cancer types are color-coded according to which type of normal organ the cancer originates from.
RNA cancer category: Low cancer specificity
PROTEIN EXPRESSIONi
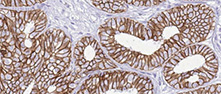
Antibody staining in 20 different cancers is summarized by a selection of four standard cancer tissue samples representative of the overall staining pattern. From left: colorectal cancer, breast cancer, prostate cancer and lung cancer. An additional fifth image can be added as a complement. The assay and annotation is described here. Note that samples used for immunohistochemistry by the Human Protein Atlas do not correspond to samples in the TCGA dataset.
For each cancer, color-coded bars indicate the percentage of patients (maximum 12 patients) with high and medium protein expression level. The cancer types are color-coded according to which type of normal organ the cancer originates from. Low or not detected protein expression results in a white bar. Mouse-over function shows details about expression level and normal tissue of origin. The images and annotations can be accessed by clicking on the cancer name or protein expression bar. If more than one antibody is analyzed, the tabs at the top of the staining summary section can be used to toggle between the different antibodies.
Organ
Expression
Alphabetical
HPA026288
CAB009626
Most colorectal, breast, prostate and urothelial cancers as well as several cases of ovarian and pancreatic cancers showed moderate to strong positivity. Gliomas, cholangiocarcinomas, thyroid and gastric cancers expressed moderate positivity. Remaining cancers were weakly stained or negative.
Most cancer tissues showed moderate cytoplasmic positivity combined with cases of nuclear staining. Several renal, prostate, liver and lung cancers were weakly stained.

 The Human Protein Atlas project is funded