Search result
|
SUBCELLULAR
RNA EXPRESSION
HUMAN CELLS
ANTIBODIES
AND VALIDATION 
Dictionary
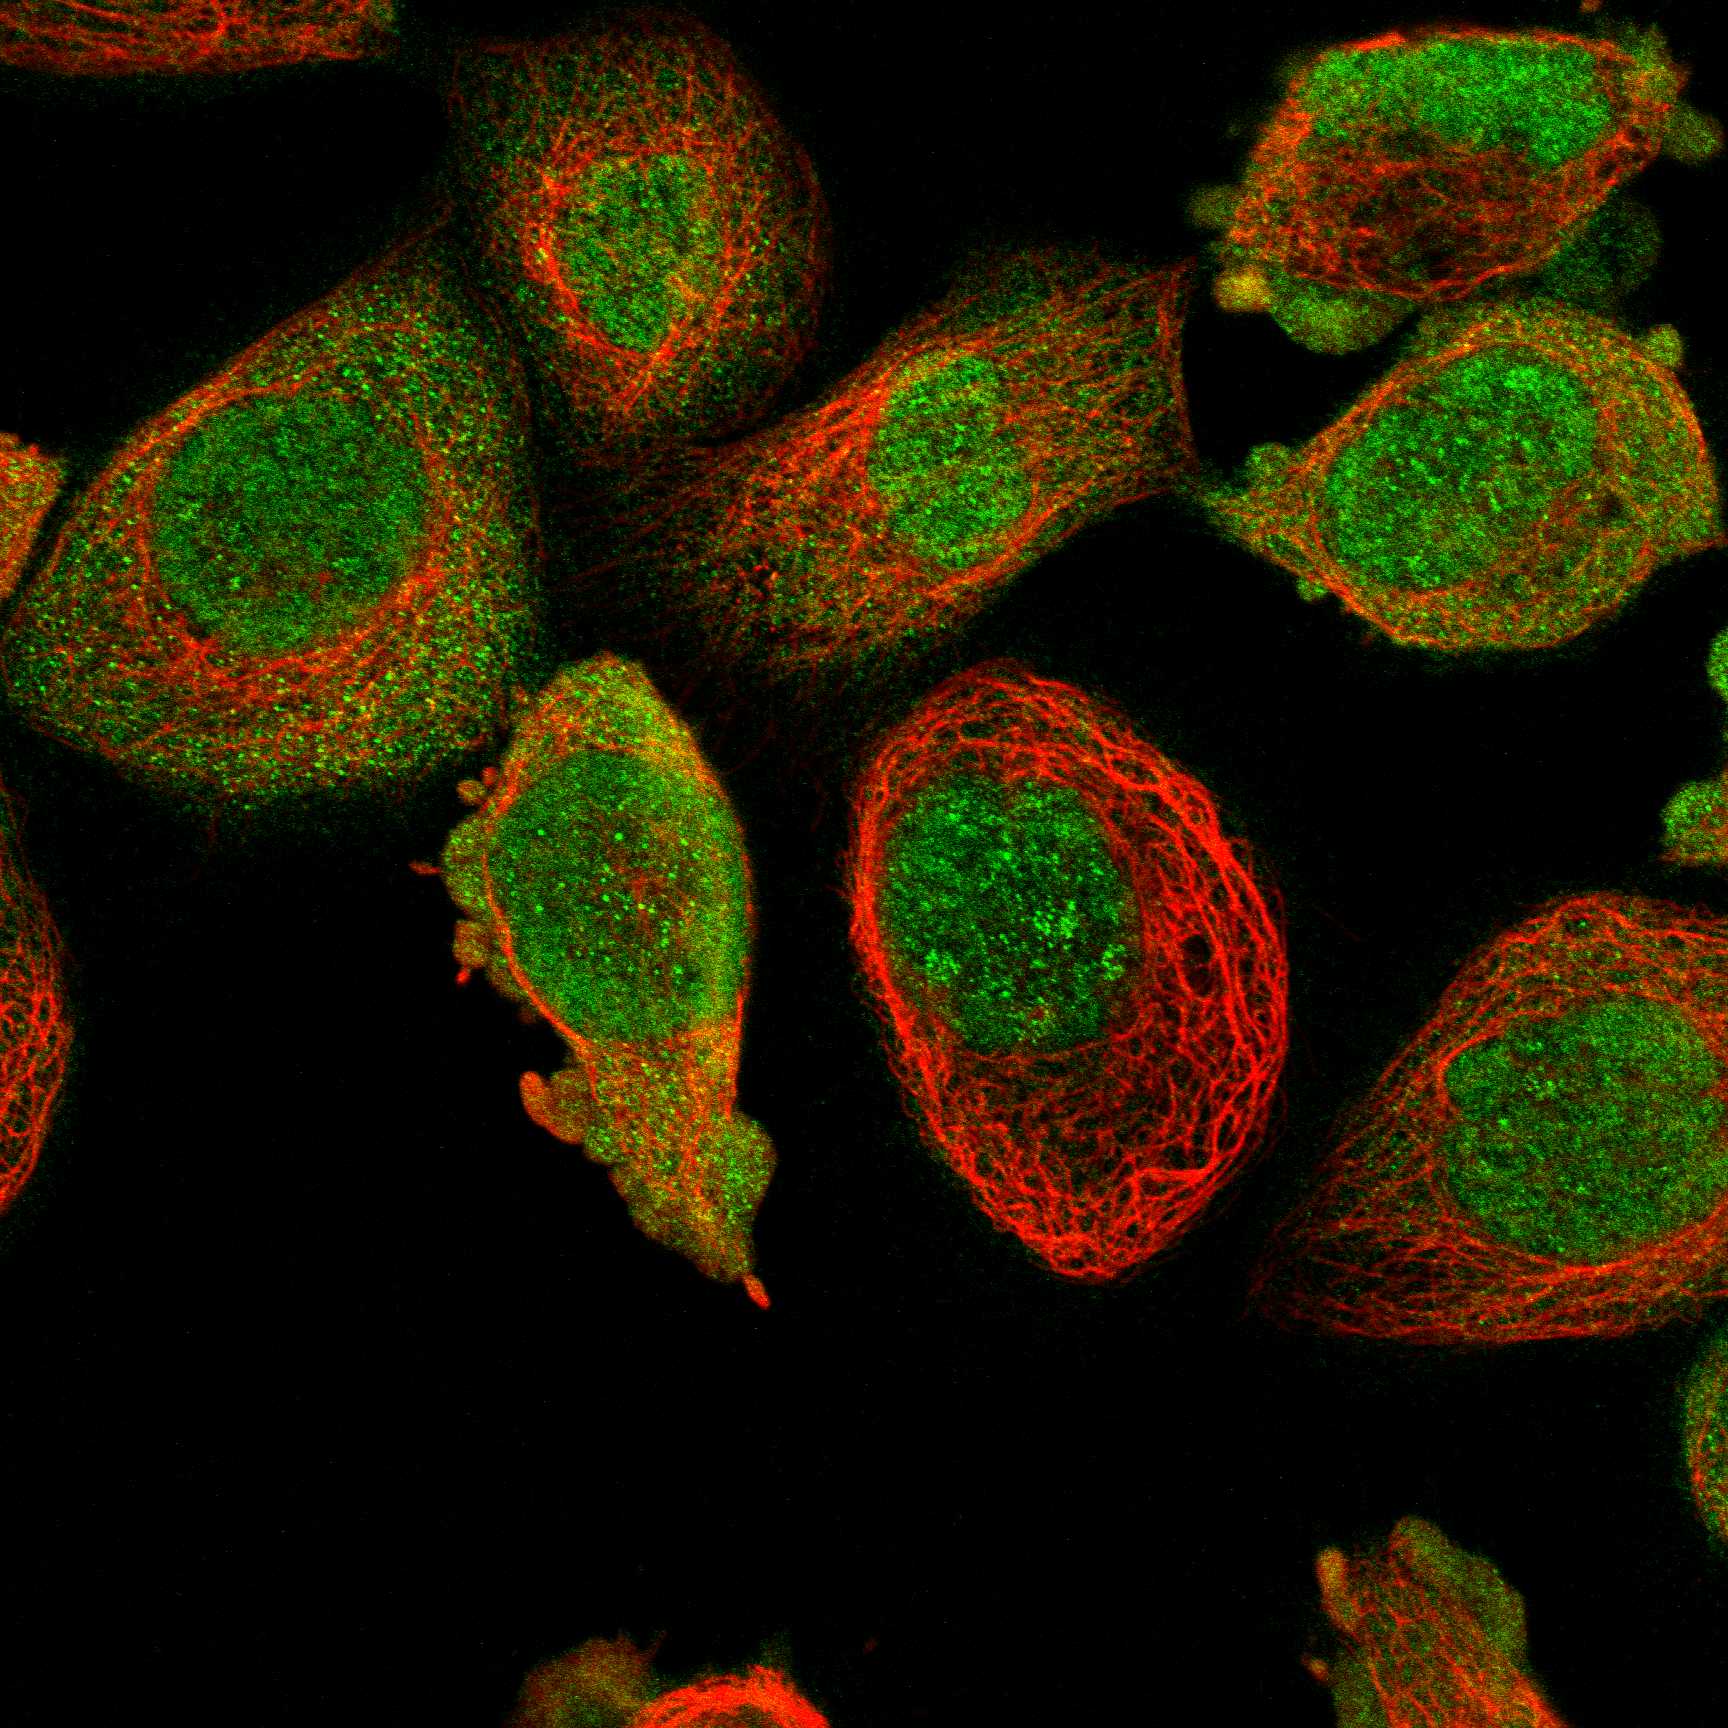
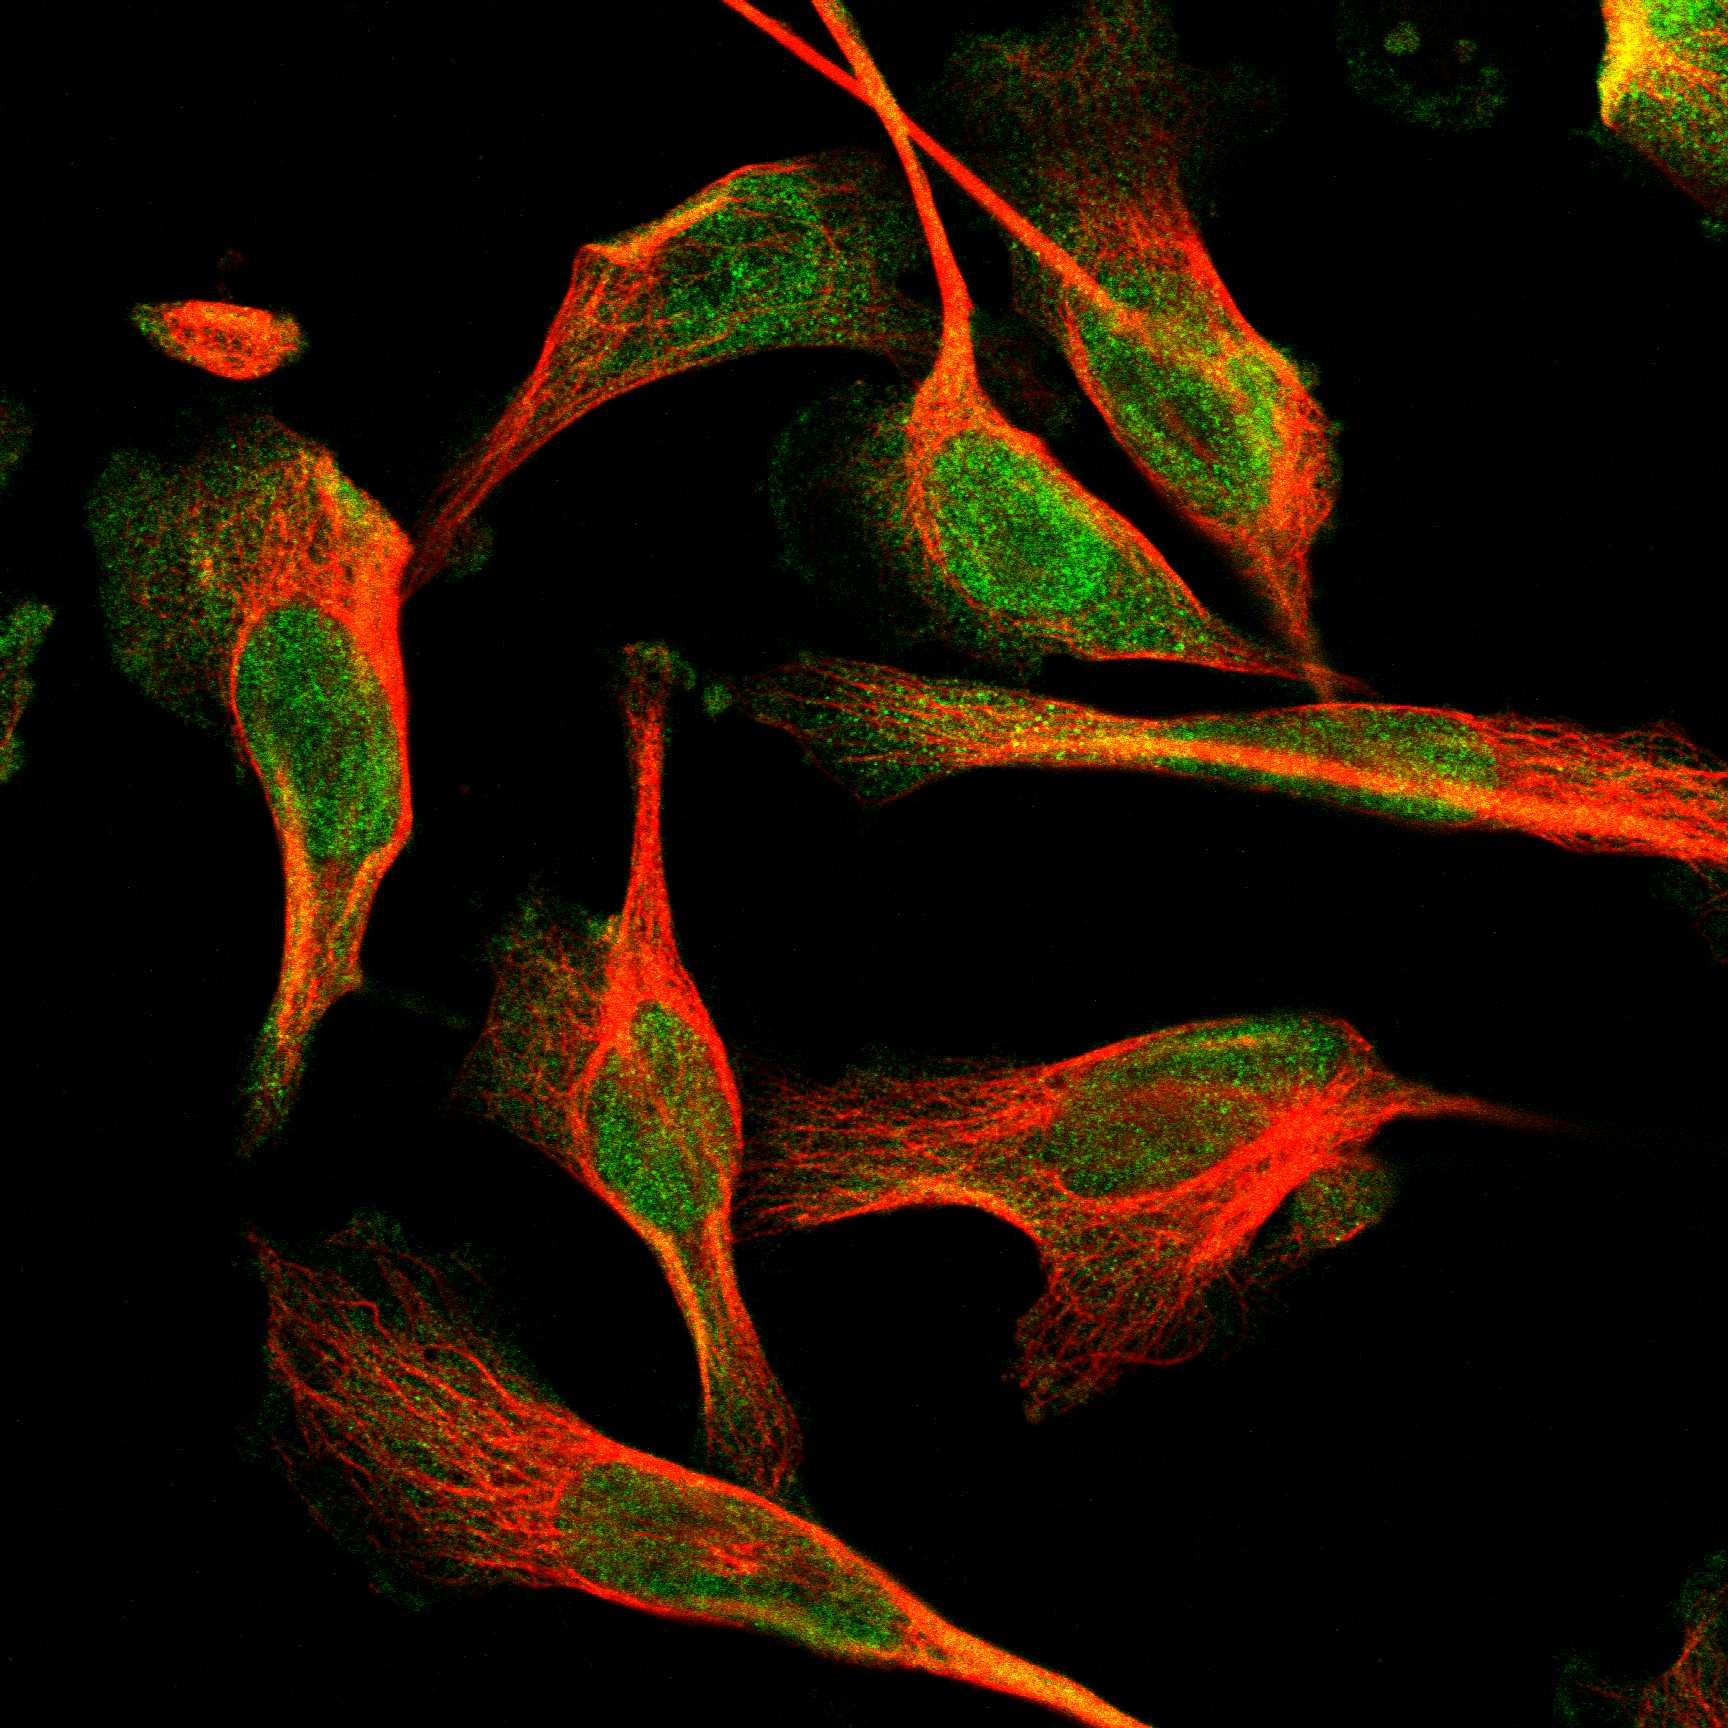
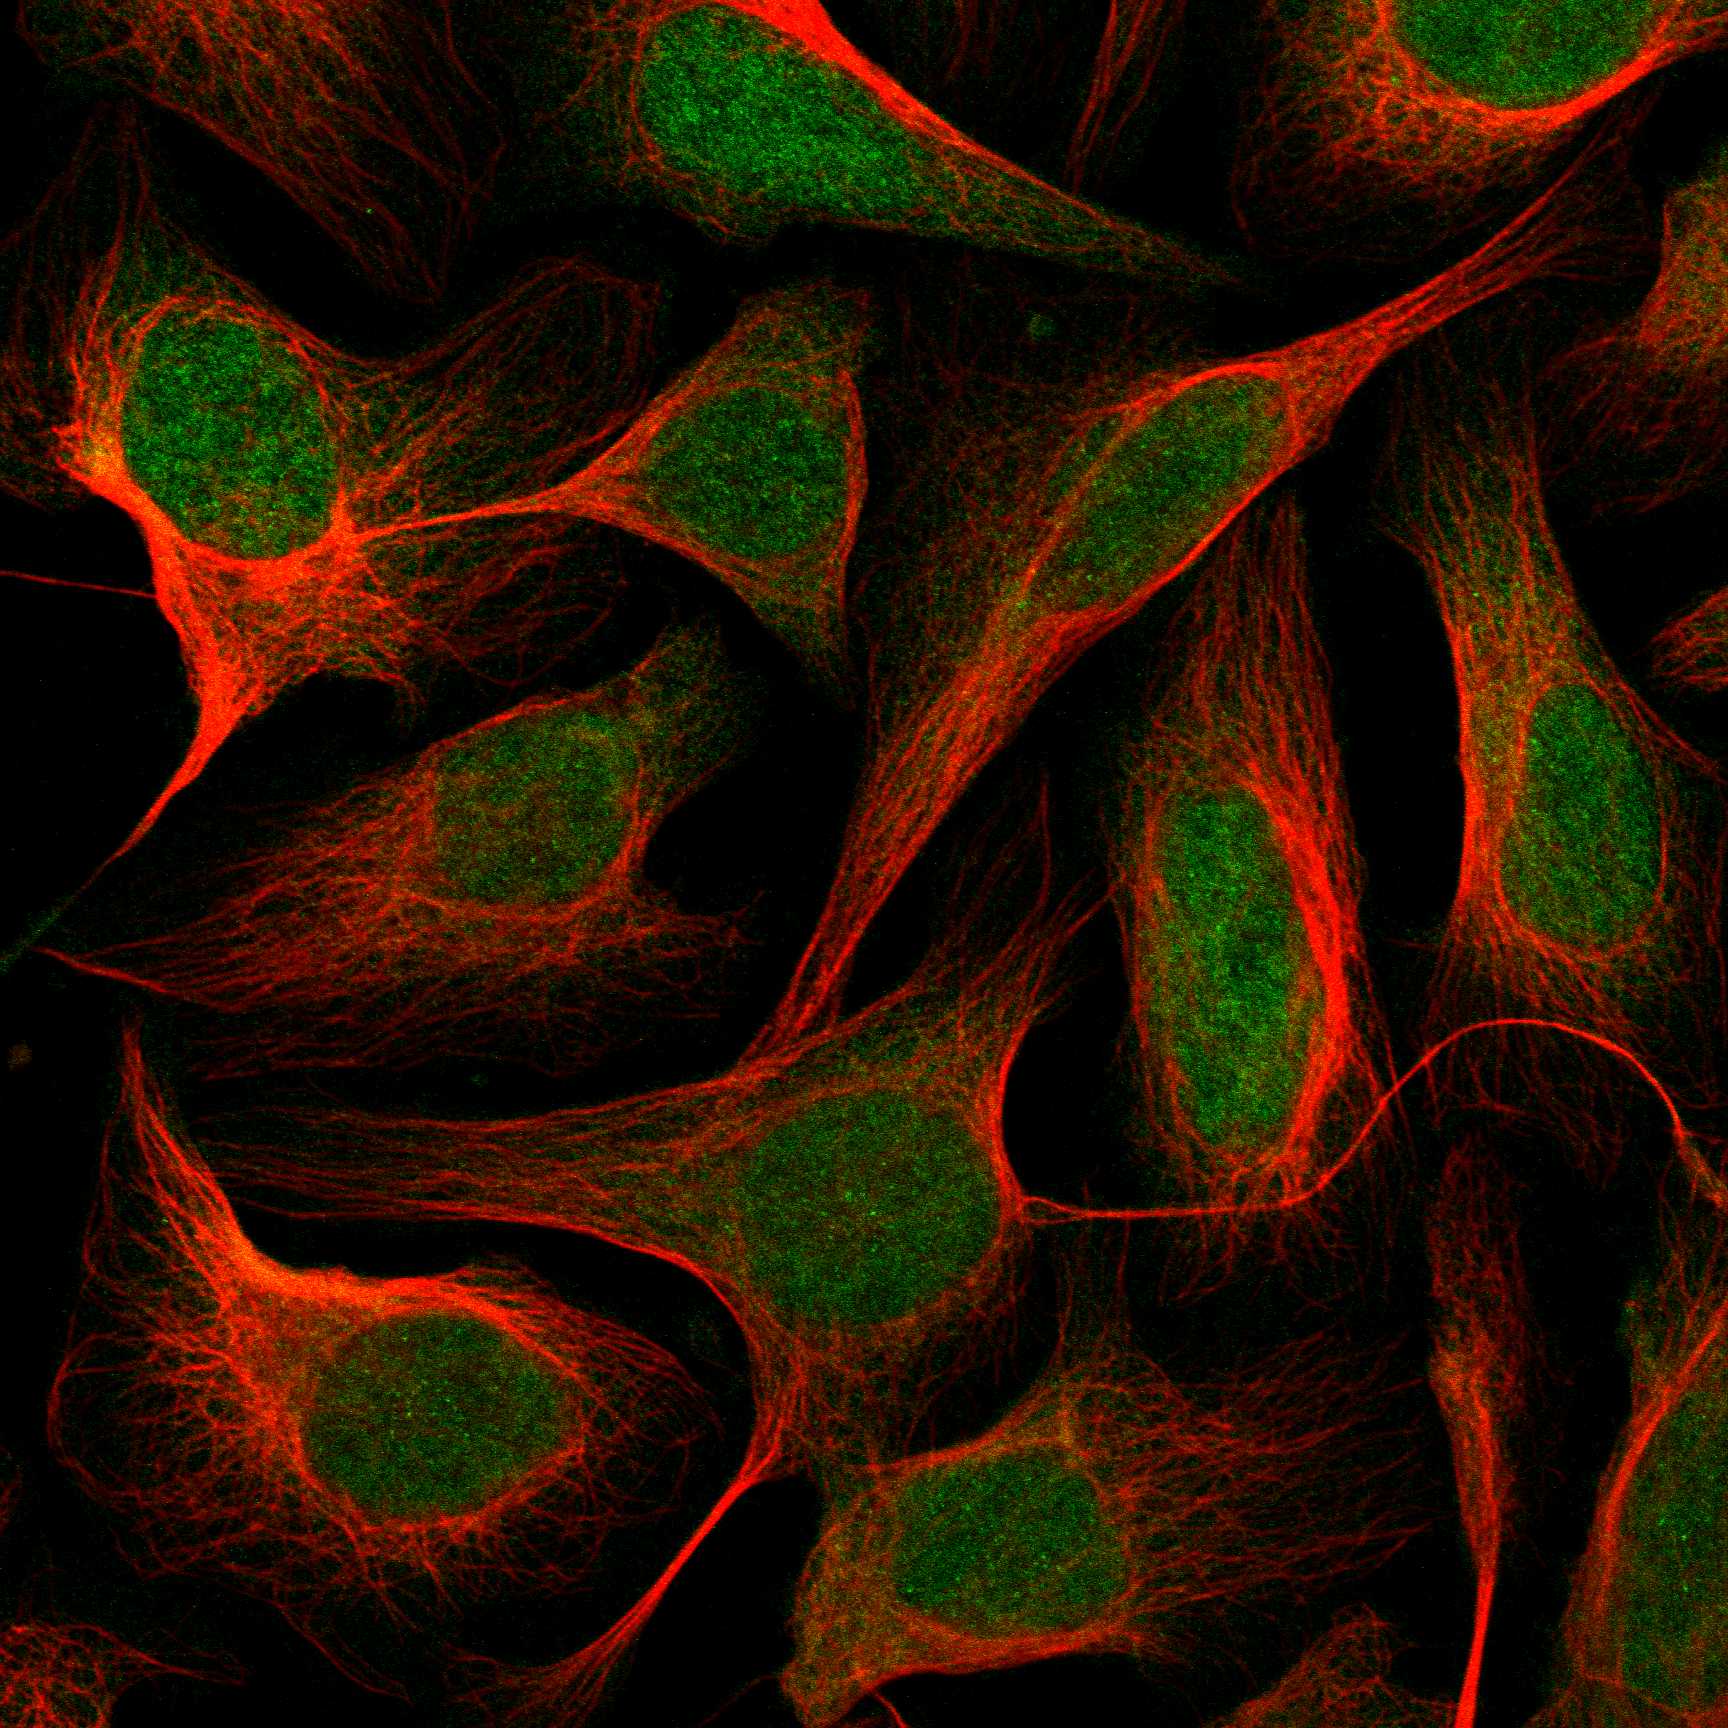
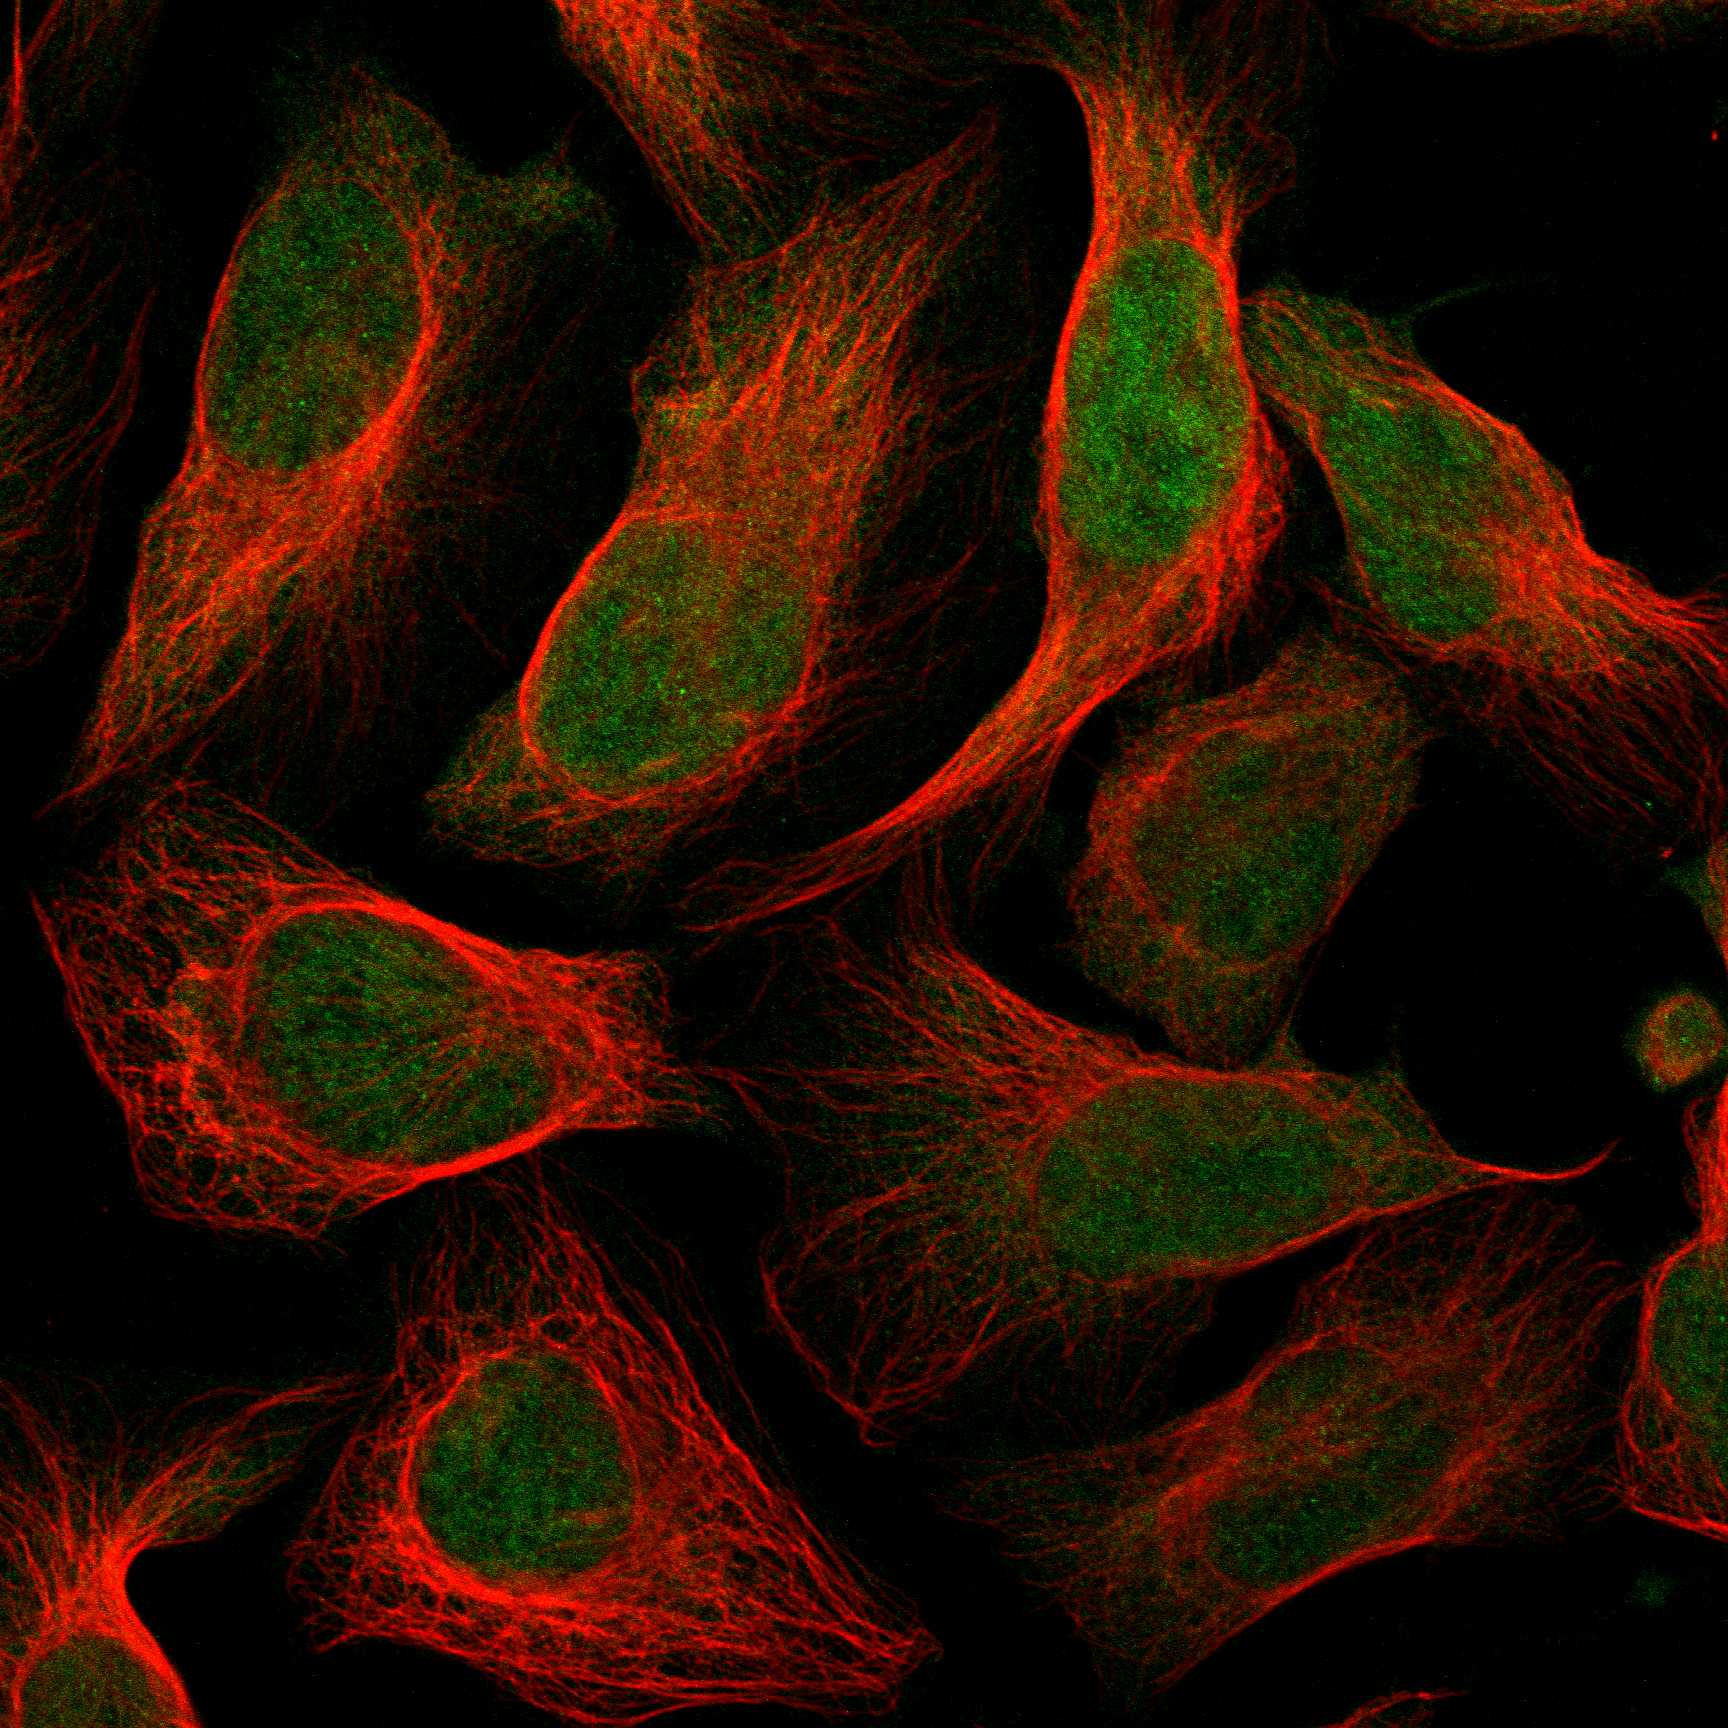
Cytosol
Nucleoplasm
Subcellular proteome
Cytosol
Nucleoplasm
|
|
|||||||||||||||||||||||||||||||||||||||||||||||||||||||||||||||||||||||||||||||||||||||
 The Human Protein Atlas project is funded