We use cookies to enhance the usability of our website. If you continue, we'll assume that you are happy to receive all cookies. More information. Don't show this again.
General description of the gene and the encoded protein(s) using information from HGNC and Ensembl, as well as predictions made by the Human Protein Atlas project.
Human gene namei
Official gene symbol, which is typically a short form of the gene name, according to HGNC.
All transcripts of all genes have been analyzed regarding the location(s) of corresponding protein based on prediction methods for signal peptides and transmembrane regions.
Genes with at least one transcript predicted to encode a secreted protein, according to prediction methods or to UniProt location data, have been further annotated and classified with the aim to determine if the corresponding protein(s) are secreted or actually retained in intracellular locations or membrane-attached.
Remaining genes, with no transcript predicted to encode a secreted protein, will be assigned the prediction-based location(s).
The annotated location overrules the predicted location, so that a gene encoding a predicted secreted protein that has been annotated as intracellular will have intracellular as the final location.
The RNA data was used to cluster genes according to their expression across tissues. Clusters contain genes that have similar expression patterns, and each cluster has been manually annotated to describe common features in terms of function and specificity.
Non-specific - DNA binding (mainly)
Tissue specificityi
The RNA specificity category is based on mRNA expression levels in the consensus dataset which is calculated from the RNA expression levels in samples from HPA and GTEX. The categories include: tissue enriched, group enriched, tissue enhanced, low tissue specificity and not detected.
Group enriched (brain, retina)
Human brain
Pig brain
Mouse brain
Regional specificityi
The regional specificity category is based on mRNA expression levels in the analysed brain samples, grouped into 13 main brain regions and calculated for the three different species. All brain expression profiles are based on data from HPA. The specificity categories include: regionally enriched, group enriched, regionally enhanced, low regional specificity and not detected. The classification rules are the same used for the tissue specificity category.
Region enhanced (cerebellum)
Low region specificity
Region enhanced (cerebellum)
Tau specificity scorei
Tau specificity score is a numerical indicator of the specificity of the gene expression across cells or tissues. The value ranges from 0 and 1, where 0 indicates identical expression across all cells/tissue types, while 1 indicates expression in a single cell/tissue type.
0.38
0.38
0.53
Regional distributioni
The regional distribution category is based on mRNA expression detected above cut off or not in the analysed brain samples, grouped into 13 main brain regions and calculated for the three different species. Brain expression for all species is based on data from HPA. The distribution categories include: detected in all, detected in many, detected in some, detected in single and not detected. The classification rules are the same used for the tissue distribution category.
Detected in all
Detected in all
Detected in all
Cellular locationi
Manually selected location of the protein positivity, observed by immunofluorescence staining in mouse brain.
Nucleus in neurons. Ventricle wall and circumventricular organs of ependymal cells.
Protein profilei
A summary of the overall protein localization across the analyzed brain tissue. The summary is based on manual annotation.
Mouse brain profiles includes a more extensive summary of the protein location while summaries with only human protein profile are more limited and are based on imported data/images from the Tissue Atlas stainings that has undergone an additional brain-centric curation step.
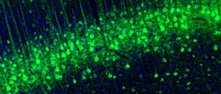
Pax6 is a transcription factor with a key regulatory role in eye and brain development. Within the mouse brain, both transcriptomic and proteomic databases show high expression in olfactory areas, where it is involved in the development of cell that process smell. However, in both human and mouse brain, PAX6 is predominantly seen in cerebellum, with a distinct distribution in cells of the granular layer.
In the current immunostaining, strong neuronal nuclear staining is noticed, which is highly restricted to a limited brain areas/nuclei:
In the olfactory bulb: granular and glomerular layers;
In the forebrain: lateral septum, piriform cortex, hypothalamic paraventricular nucleus, multiple amygdala nuclei, zona incerta, lateral hypothalamus, habenulae, caudal part of the hippocampus, entorhinal cortex;
In the brainstem: periaqueductal gray matter, dorsal raphe and raphe magnus, vestibular nucelus;
In the cerebellum: the staining is highly abundant in the cerebellar molecular layer.
In addition, very rare, sparse immunoreactive nuclei are noticed throughout the entire brain.
Normalized RNA expression levels (nTPM) shown for the 13 brain regions. Color coding is based on brain region and the bar shows the highest expression among the subregions included. To access sample data, click on region name or bar.
Read more about normalized expression levels in <a href="/about/assays+annotation#normalization_rna"_blank">Assays & Annotation.
CTX
HPF
AMY
BG
TH
HY
MB
CB
P
M
SC
WM
CP
Cerebral cortex
Additional Prefrontal Cortex dataset
Hippocampal formation
Amygdala
Basal ganglia
Thalamus
Hypothalamus
Midbrain
Cerebellum
Pons
Medulla oblongata
Spinal cord
White matter
Choroid plexus
COMPARISON BRAIN RNA EXPRESSION
GTEX AND FANTOM HUMAN BRAIN
GTEx Human brain RNA-Seq dataseti
GTEx dataset RNA-seq tissue data generated by the Genotype-Tissue Expression (GTEx) project is reported as mean nTPM, corresponding to mean values of the different individual samples for respective subregion. Highest expression among the subregions represents the brain region. To access sample data, click on region name or bar.
FANTOM5 dataset Tissue data for RNA expression obtained through Cap Analysis of Gene Expression (CAGE) generated by the FANTOM5 project are reported as Scaled Tags Per Million. To access sample data, click on region name or bar.
HPA Pig dataset HPA RNA-seq tissue data is reported as mean nTPM (normalized expression) for each of the brain regions analyzed in pig. The detailed pages (reached when clicking a bar or regional name) show nTPM values at the individual sample level. To access sample data, click on region name or bar.
The pig brain transcriptomics project is a collaborative project between human protein atlas and the Lars Bolund institute of regenerative Medicine (Dr. Yonglun Luo), BGI-Qingdao, China.
HPA Mouse dataset HPA RNA-seq tissue data is reported as mean nTPM (normalized expression) for each of the brain regions analyzed in mouse. The detailed pages (reached when clicking a bar or regional name) show nTPM values at the individual sample level. To access sample data, click on region name or bar.
The Human brain protein data is based on curated and manually selected Tissue Atlas data. The standard brain regions used in the Tissue Atlas are cerebral cortex, caudate nucleus, hippocampus and cerebellum, only selected cases include information on hypothalamus or retina. The score is based on knowledge-based annotation of the protein location in the main cell types. For genes where more than one antibody has been used, a collective score is set displaying the estimated true protein expression.
Each bar represents the highest expression score found in a particular tissue. Protein expression scores are based on a best estimate of the "true" protein expression from a knowledge-based annotation, described more in detail under Assays & annotation. For genes where more than one antibody has been used, a collective score is set displaying the estimated true protein expression.
MOUSE BRAIN PROTEIN LOCATIONi
Mouse brain protein profiles are based in serial sections of the adult mouse brain analyzed by immunofluorescence. The staining intensity and regional distribution is manually summarized.
Protein profile
Pax6 is a transcription factor with a key regulatory role in eye and brain development. Within the mouse brain, both transcriptomic and proteomic databases show high expression in olfactory areas, where it is involved in the development of cell that process smell. However, in both human and mouse brain, PAX6 is predominantly seen in cerebellum, with a distinct distribution in cells of the granular layer.
In the current immunostaining, strong neuronal nuclear staining is noticed, which is highly restricted to a limited brain areas/nuclei:
In the olfactory bulb: granular and glomerular layers;
In the forebrain: lateral septum, piriform cortex, hypothalamic paraventricular nucleus, multiple amygdala nuclei, zona incerta, lateral hypothalamus, habenulae, caudal part of the hippocampus, entorhinal cortex;
In the brainstem: periaqueductal gray matter, dorsal raphe and raphe magnus, vestibular nucelus;
In the cerebellum: the staining is highly abundant in the cerebellar molecular layer.
In addition, very rare, sparse immunoreactive nuclei are noticed throughout the entire brain.
Cellular location
Nucleus in neurons. Ventricle wall and circumventricular organs of ependymal cells.
Protein profile reliability
Enhanced based on HPA030775
HPA Mouse staining intesityi
The score is based on the relative fluorescence, defined as intensity of the annotated region relative to the intensity of the region with highest intensity. The digitalized images are processed (axel-adjusted and tissue edges defined) and regions of interest (ROIs) are then marked. These ROIs are then used for image analysis and the relative fluorescence intensity is listed for each region. For more data and regional information click on the bar or the regional name.
Selected annotations
Thalamus
Midbrain
Cerebellum
FRONTBACK
EXPRESSION CLUSTERING & CORRELATIONi
The RNA data was used to cluster genes according to their expression across samples. The resulting clusters have been manually annotated to describe common features in terms of function and specificity. The annotation of the cluster is displayed together with a confidence score of the gene's assignment to the cluster. The confidence is calculated as the fraction of times the gene was assigned to this cluster in repeated calculations and is reported between 0 to 1, where 1 is the highest possible confidence. The clustering results are shown in a UMAP, where the cluster this gene was assigned to is highlighted as a colored area in which most of the cluster genes reside. A table shows the 15 most similar genes in terms of expression profile.
PAX6 is part of cluster 35Non-specific - DNA binding with confidencei
Confidence is the fraction of times a gene was assigned to the cluster in repeated clustering, and therefore reflects how strongly associated it is to the cluster. A confidence of 1 indicates that the gene was assigned to this cluster in all repeated clusterings.
Correlation between the selected gene and neighboring gene. Correlation is calculated as Spearman correlation in PCA space based on the RNA-seq expression data.
Clusteri
ID of the expression cluster of the neighboring gene.


 The Human Protein Atlas project is funded