We use cookies to enhance the usability of our website. If you continue, we'll assume that you are happy to receive all cookies. More information. Don't show this again.
On the top, protein expression in current human tissue, based on all annotated cell types, is reported with the units not detected (n), low (l), medium (m) and high (h). Underneath, protein expression in each annotated cell type are reported using the same units.
Protein expression data is based on knowledge-based annotation. For genes where more than one antibody has been used, a collective score is set.
If knowledge-based annotation could not be performed for a gene, no data is displayed here. View antibody staining data further down this page.
h
m
l
n
Cells in glomeruli:
Not detected
Cells in tubules:
Low
RNA expressioni
A summary of mRNA expression data available for current tissue based on several datasets. The mRNA expression levels in human tissues are based on RNA-seq data generated by the Human Protein Atlas (HPA), Genotype-Tissue Expression (GTEx) portal and CAGE data generated by the FANTOM5 consortium. Consensus normalized expression levels for human tissues was created by combining the data from HPA and GTEx datasets.
The mRNA expression levels in pig are based on RNA-seq data generated by the Human Protein Atlas (HPA), and for mouse, HPA data and in situ hybridization generated by the Allen brain atlas are reported.
Scroll down to view mRNA expression data in more detail.
Consensus:
555.5
nTPM
HPA:
555.5
nTPM
GTEx:
385.1
nTPM
FANTOM5:
693.6
Scaled Tags Per Million
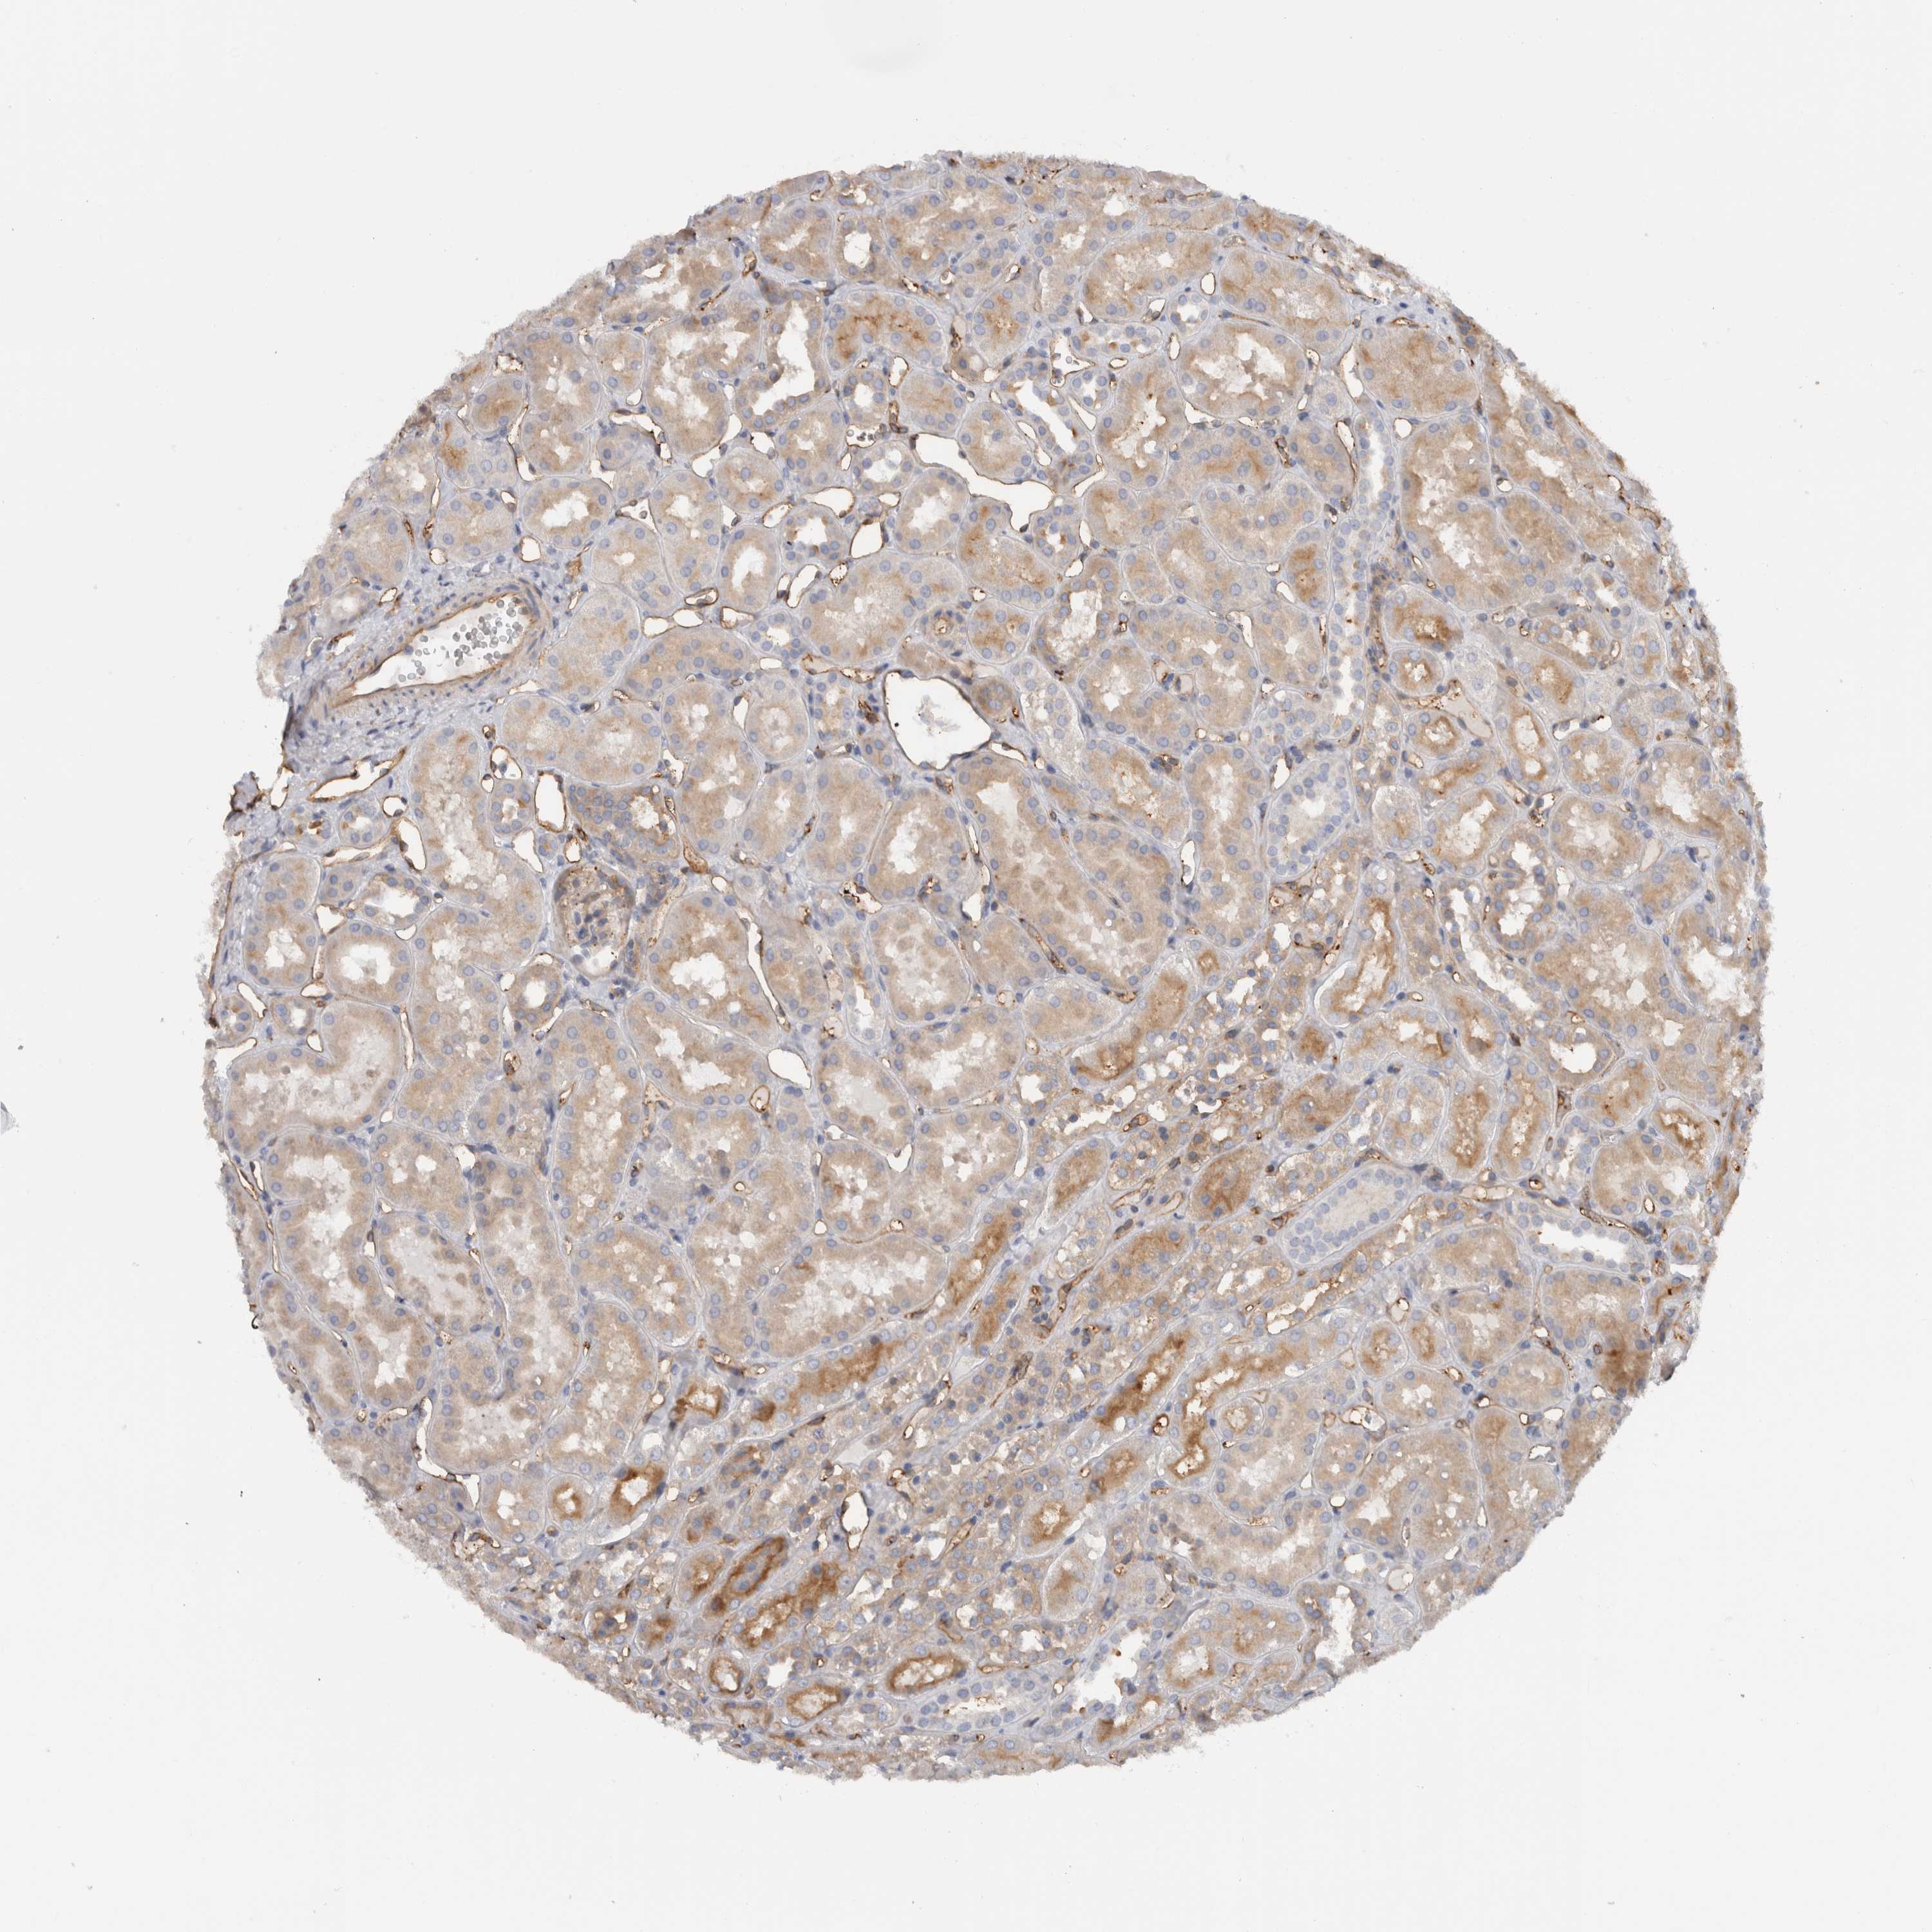
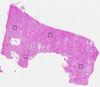
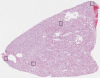
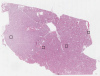
KIDNEY - Antibody stainingi
Antibody staining in the annotated cell types in the current human tissue is reported as not detected, low, medium, or high, based on conventional immunohistochemistry profiling in selected tissues. This score is based on the combination of the staining intensity and fraction of stained cells.
Each image is clickable and will lead to virtual microscopy that enables deeper exploration of all samples and also displays staining intensity scores, fraction scores and subcellular localization as well as patient and tissue information for each sample.
Antibody HPA026494
Antibody CAB001448
Cells in glomeruli
Not detected
Not detected
Cells in tubules
Low
Low
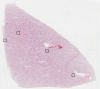
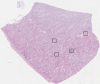
KIDNEY - HPA RNA-seqi
The RNA-seq details section shows detailed information about the individual samples used for the transcript profiling and results of the RNA-seq analysis.
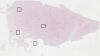
Information about each individual sample is listed below, including gender, age, a tissue section image and estimated fractions of cell types. nTPM (normalized transcripts per million) values give a quantification of the gene abundance which is comparable between different genes and samples.
Average nTPM
555.5
Female, age 58
Kidney sample 55 nTPM: 444
Cell types%
Cells in tubules:
60
Cells in glomeruli:
20
Fibroblasts:
5
Other cell types:
15
Female, age 67
Kidney sample 56 nTPM: 360.5
Cell types%
Cells in tubules:
70
Cells in glomeruli:
15
Fibroblasts:
10
Other cell types:
5
Female, age 55
Kidney sample 57 nTPM: 406.5
Cell types%
Cells in tubules:
80
Cells in glomeruli:
10
Fibroblasts:
5
Other cell types:
5
Male, age 46
Kidney sample 58 nTPM: 339
Cell types%
Cells in tubules:
60
Cells in glomeruli:
25
Fibroblasts:
5
Other cell types:
10
Female, age 57
Kidney sample 358 nTPM: 653.6
Cell types%
Cells in tubules:
60
Cells in glomeruli:
10
Fibroblasts:
10
Other cell types:
20
Male, age 78
Kidney sample 377 nTPM: 752.9
Cell types%
Cells in tubules:
65
Cells in glomeruli:
10
Fibroblasts:
5
Other cell types:
20
Male, age 73
Kidney sample 380 nTPM: 703.5
Cell types%
Cells in tubules:
60
Cells in glomeruli:
10
Fibroblasts:
10
Other cell types:
20
Female, age 59
Kidney sample 394 nTPM: 642.4
Cell types%
Cells in tubules:
65
Cells in glomeruli:
10
Fibroblasts:
10
Other cell types:
15
Female, age 48
Kidney sample 414 nTPM: 696.6
Cell types%
Cells in tubules:
60
Cells in glomeruli:
5
Fibroblasts:
10
Other cell types:
25
KIDNEY - GTEx RNA-seqi
RNA-Seq data generated by the Genotype-Tissue Expression (GTEx) project from human tissues is reported as mean nTPM. More information can be found on the GTEx portal.
Distribution across the dataset is visualized with box plots, shown as median and 25th and 75th percentiles. Points are displayed as outliers if they are above or below 1.5 times the interquartile range. nTPM values of the individual samples are presented next to the box plot.
Average nTPM
385.1
GTEx sample id
Sample description
nTPM
Kidney - Cortex Average nTPM: 316.2
Samples: 85
Max nTPM: 837.6
Min nTPM: 125.1
Std nTPM: 122.6
Median nTPM: 288.8
GTEX-1N2EF-1426-SM-EXUSH
60-69 years, male
837.6
GTEX-145MN-0326-SM-5QGQI
30-39 years, male
651.7
GTEX-1PWST-2226-SM-EVR3G
70-79 years, male
637.0
GTEX-QDVN-1626-SM-48TZC
50-59 years, male
623.6
GTEX-13O1R-2526-SM-5N9FW
60-69 years, male
573.4
GTEX-ZYFG-1626-SM-5GZYY
60-69 years, female
544.5
GTEX-11TTK-1926-SM-5PNW8
60-69 years, female
485.7
GTEX-12696-0926-SM-5FQTV
60-69 years, male
467.4
GTEX-P4QS-1126-SM-3NMD5
60-69 years, male
459.6
GTEX-1I1GP-1926-SM-CNNQU
50-59 years, male
456.7
GTEX-13RTJ-2226-SM-5S2Q1
60-69 years, male
428.5
GTEX-1CB4J-1926-SM-7MGX8
60-69 years, male
409.8
GTEX-1HB9E-1826-SM-D4P33
50-59 years, male
405.1
GTEX-Y5V6-2026-SM-5IFHO
60-69 years, male
399.7
GTEX-14C39-2126-SM-664OH
40-49 years, male
398.3
GTEX-1H3VY-1926-SM-9JGHJ
50-59 years, male
397.9
GTEX-1LG7Y-2726-SM-D5OVW
50-59 years, male
392.9
GTEX-1GTWX-1826-SM-9QEHG
60-69 years, male
387.8
GTEX-17F97-1926-SM-7IGM4
50-59 years, male
379.3
GTEX-XPVG-0526-SM-4B65N
50-59 years, male
378.4
GTEX-1497J-0826-SM-5NQAJ
60-69 years, male
377.1
GTEX-1JJ6O-2526-SM-AHZ3J
60-69 years, male
372.2
GTEX-REY6-1826-SM-EAZAT
60-69 years, male
368.7
GTEX-QLQW-1626-SM-CMKFE
30-39 years, male
353.6
GTEX-1F48J-2226-SM-7MXTN
50-59 years, female
353.2
GTEX-1MUQO-2526-SM-E9TJN
60-69 years, male
352.8
GTEX-11GS4-2326-SM-5A5KS
60-69 years, male
345.3
GTEX-1JMQK-1926-SM-CJI3B
60-69 years, male
342.7
GTEX-1R9PO-1626-SM-E6CPT
60-69 years, female
342.0
GTEX-ZYT6-2226-SM-5GIC9
30-39 years, male
340.0
GTEX-1OJC4-2326-SM-DTXA5
50-59 years, female
338.4
GTEX-1AX8Z-2326-SM-731CR
60-69 years, male
335.7
GTEX-1HCU7-1826-SM-A9G2A
50-59 years, male
331.2
GTEX-1GF9W-1326-SM-7P8PX
60-69 years, male
327.7
GTEX-ZLFU-0926-SM-5P9F8
40-49 years, male
323.1
GTEX-1JMPZ-1226-SM-ARU8Y
30-39 years, male
318.2
GTEX-1N2DW-1826-SM-EAZ54
50-59 years, male
317.2
GTEX-17F96-1926-SM-7MGWY
70-79 years, male
316.6
GTEX-1J1OQ-1426-SM-AHZ3P
40-49 years, female
314.5
GTEX-14C5O-2026-SM-5YYB1
60-69 years, male
301.3
GTEX-NPJ8-2226-SM-3TW8D
40-49 years, male
296.4
GTEX-12WSG-0826-SM-5EQ5A
50-59 years, female
293.9
GTEX-ZVZP-0926-SM-5GIDB
50-59 years, male
288.8
GTEX-147F4-2626-SM-5Q5CS
50-59 years, male
288.7
GTEX-1C6VQ-2326-SM-7IGN1
50-59 years, male
286.9
GTEX-1JMLX-1526-SM-AHZ3N
50-59 years, male
284.6
GTEX-ZE9C-1426-SM-4WKGM
60-69 years, male
281.3
GTEX-ZC5H-1726-SM-5HL7X
40-49 years, female
271.3
GTEX-1A8FM-2026-SM-7P8RN
50-59 years, female
270.5
GTEX-1GN1U-2126-SM-AHZ4J
50-59 years, female
270.1
GTEX-1A3MW-2226-SM-73KUX
60-69 years, female
265.9
GTEX-13OVL-1826-SM-5KLZR
50-59 years, male
264.1
GTEX-1EKGG-2226-SM-7IGOA
60-69 years, male
255.7
GTEX-1NV8Z-2226-SM-EXOJ2
60-69 years, male
253.7
GTEX-QDT8-1726-SM-EYYV6
30-39 years, female
253.0
GTEX-1399S-0526-SM-5IJG8
30-39 years, female
251.8
GTEX-13112-2126-SM-5GCO4
50-59 years, male
245.1
GTEX-13OVI-1126-SM-5KLZF
60-69 years, female
244.7
GTEX-1H3NZ-2126-SM-9WPQ6
60-69 years, male
243.6
GTEX-1GMR3-2426-SM-7MXV2
40-49 years, male
242.0
GTEX-13NYB-1726-SM-5N9G2
40-49 years, male
238.0
GTEX-T5JC-1526-SM-4DM68
20-29 years, male
234.8
GTEX-1QP6S-1526-SM-EXUSG
40-49 years, male
234.1
GTEX-1E2YA-1626-SM-7MGXS
50-59 years, male
231.9
GTEX-T6MN-1826-SM-EXOHN
50-59 years, male
218.3
GTEX-11OF3-1326-SM-5N9FJ
60-69 years, male
218.1
GTEX-Y5V5-1226-SM-EYYVP
60-69 years, female
216.5
GTEX-1GF9V-1926-SM-9JGHE
60-69 years, male
216.4
GTEX-15CHQ-2126-SM-6871M
60-69 years, male
214.9
GTEX-1IKK5-0926-SM-A9G2U
60-69 years, male
214.2
GTEX-1K9T9-1826-SM-CXZK2
50-59 years, female
213.0
GTEX-O5YV-1226-SM-EV795
60-69 years, female
209.9
GTEX-13OW6-1826-SM-5N9F9
50-59 years, male
209.0
GTEX-1BAJH-1826-SM-731DA
70-79 years, male
208.4
GTEX-S33H-1426-SM-EZ6L7
30-39 years, male
206.1
GTEX-ZDXO-0226-SM-4WKH7
60-69 years, male
204.4
GTEX-1KWVE-0826-SM-CXZKO
30-39 years, male
198.6
GTEX-14E6D-2526-SM-5YYA9
50-59 years, male
197.6
GTEX-1HBPI-2026-SM-CE6RZ
50-59 years, male
193.5
GTEX-16MT8-1926-SM-7EPGL
60-69 years, female
176.6
GTEX-RN64-1626-SM-48FD7
50-59 years, male
173.8
GTEX-15DYW-2026-SM-6AJBD
60-69 years, female
169.4
GTEX-1IL2V-1826-SM-ARU7R
70-79 years, male
167.4
GTEX-1JMQJ-1726-SM-E9U4V
50-59 years, male
147.1
GTEX-17HHY-2326-SM-7KFSR
50-59 years, male
125.1
Show allShow less
Kidney - Medulla Average nTPM: 385.1
Samples: 4
Max nTPM: 523.9
Min nTPM: 236.2
Std nTPM: 103.8
Median nTPM: 390.1
GTEX-T5JC-1626-SM-EZ6KW
20-29 years, male
523.9
GTEX-RU72-1926-SM-EAZ3F
50-59 years, female
419.1
GTEX-TKQ2-0626-SM-EZ6LB
50-59 years, male
361.1
GTEX-R55E-2026-SM-EZ6L1
20-29 years, male
236.2
KIDNEY - FANTOM5 CAGEi
RNA expression in human tissues obtained through Cap Analysis of Gene Expression (CAGE) generated by the FANTOM5 project are reported as Scaled Tags Per Million.
 The Human Protein Atlas project is funded